Continuous Vulnerability Monitoring: How It Works
A developer adds a dependency mid-sprint to solve a routing problem. It works, the pull request merges, and the team moves on. Four days later, a CVE is disclosed against…


Cybersecurity metrics help organizations evaluate security performance, identify gaps, prioritize risk, and measure improvement over time. The right key performance indicators (KPIs) can also help security leaders explain technical risks and investment needs to executives, boards, developers, and compliance teams.
The challenge is deciding what to measure. A dashboard can contain hundreds of data points without answering the questions that matter: Is risk decreasing? Are teams remediating critical vulnerabilities quickly enough? Are security controls covering the applications and assets that need them?
This guide explains the difference between cybersecurity metrics and KPIs, which measurements are most useful, common measurement challenges, and how to build dashboards that drive action.
Cybersecurity metrics are quantifiable measurements used to track an organization’s security posture, exposure, controls, and program performance.
Examples include:
A KPI is a metric tied directly to a defined goal. All KPIs are metrics, but not every metric is a KPI.
For example, the number of alerts received each month is a metric. It becomes part of a KPI only when it is connected to an objective, such as reducing low-confidence alerts by 20% without decreasing detection coverage.
A useful KPI should have:
Without those elements, a KPI can become a number that teams report without using.
Enterprise cybersecurity metrics cover areas such as incident response, identity, endpoints, networks, vendors, training, and compliance.
Application-security metrics focus more specifically on software development and application risk. Examples include:
Mean time to detect (MTTD) is traditionally an incident-response metric that measures how long it takes to identify an incident after it begins. For vulnerabilities discovered during development, teams may instead track how long a vulnerability existed before discovery or at which stage of the SDLC it was found.
The distinction matters because combining incident and vulnerability metrics under the same name can make reporting difficult to interpret.
Cybersecurity metrics help organizations direct resources toward their highest risks and determine whether controls are producing the intended outcomes.
They can support:
The financial consequences of security failures also make measurement important. IBM’s 2025 Cost of a Data Breach Report placed the global average cost of a breach at $4.44 million. The figure does not predict what any individual organization will lose, but it shows why security leaders need evidence to support investment and risk decisions.
Organizations can also use financial-risk models such as:
These models depend heavily on assumptions. Teams should document the data, ranges, and confidence levels behind their estimates instead of presenting a single number as certain.
Operational metrics measure day-to-day security activity and performance.
Examples include:
These metrics help teams identify bottlenecks and determine whether security operations are improving.
Compliance metrics track the status of requirements, controls, evidence, and remediation associated with laws, regulations, contracts, and industry standards.
Examples include:
Metrics can support audit readiness and control monitoring, but they do not guarantee compliance. Compliance depends on scope, implementation, evidence, and the requirements that apply to the organization.
Risk-based metrics connect technical exposure to business impact and likelihood.
Examples include:
Risk-based metrics help CISOs and boards prioritize investment based on potential impact rather than activity volume alone.
The best set of metrics depends on the organization’s goals, systems, threat model, and maturity. The following measurements provide a practical starting point.
| Metric | Definition |
| Mean time to detect (MTTD) | Average time between an incident beginning and its detection |
| Mean time to acknowledge (MTTA) | Average time between an alert or incident being created and a responder acknowledging it |
| Mean time to contain (MTTC) | Average time required to stop an incident from causing additional harm |
| Mean time to recover | Average time required to restore affected services or operations |
| Incident volume | Number of confirmed incidents during a defined period |
| Incident severity | Distribution of incidents by business impact or severity |
| Average incident cost | Estimated average cost of investigation, downtime, recovery, legal work, and other consequences |
“MTTR” can mean time to respond, recover, resolve, or remediate depending on the organization. Define the term explicitly or use a more specific label.
| Metric | Definition |
| Critical vulnerabilities open | Number of unresolved critical vulnerabilities |
| Vulnerabilities exceeding SLA | Findings that remain open beyond the organization’s remediation target |
| Time to remediate | Time between vulnerability confirmation and resolution |
| Remediation rate | Percentage of findings resolved during a defined period |
| Vulnerability recurrence | Frequency with which the same vulnerability type reappears |
| Reopen rate | Percentage of findings reopened after being marked resolved |
| Risk acceptance and exceptions | Number, age, and scope of approved unresolved risks |
| Vulnerability escape rate | Percentage of vulnerabilities discovered after release rather than before it |
Median remediation time may be more useful than the mean when a few very old findings distort the average.
| Metric | Definition |
| SAST coverage | Percentage of in-scope applications or repositories receiving required static analysis |
| SCA coverage | Percentage of applications receiving required open-source dependency analysis |
| Policy-gate pass rate | Percentage of builds, pull requests, or releases meeting defined security policies |
| Critical findings reaching production | Number of critical findings released without remediation or an approved exception |
| Finding density | Confirmed findings relative to an agreed code-size or functional measure |
| Recurring security defects | Vulnerability classes that repeatedly appear in new code |
| Remediation by application risk | Resolution performance segmented by application criticality |
| Open-source exposure | Vulnerable, unsupported, or outdated third-party components |
| License-policy violations | Components that conflict with the organization’s approved license policies |
Coverage metrics matter because a dashboard can appear healthy when it shows only scanned applications. Organizations should report which systems are outside the required security process, not just findings from those already covered.
| Metric | Definition |
| Patch compliance rate | Percentage of in-scope systems patched within the required timeframe |
| Patch deployment time | Time between patch availability or approval and deployment |
| Unsupported systems | Number of assets using unsupported software or operating systems |
| Unknown devices | Unidentified devices detected in the organization’s environment |
| Asset inventory coverage | Percentage of expected assets represented in the inventory |
| Metric | Definition |
| Unauthorized access attempts | Detected attempts to access systems without authorization |
| Privileged-account coverage | Percentage of privileged accounts managed through required controls |
| Access-review completion | Percentage of required access reviews completed on time |
| Dormant accounts | Accounts that remain active despite extended inactivity |
| MFA coverage | Percentage of in-scope accounts protected by multifactor authentication |
| Metric | Definition |
| Training completion | Percentage of employees completing required security training |
| Simulation reporting rate | Percentage of simulated phishing messages reported appropriately |
| Simulation interaction rate | Percentage of employees interacting with a simulated malicious message |
| Repeat simulation failures | Number or percentage of users repeatedly failing simulations |
Training metrics should measure outcomes, not just attendance. A 100% completion rate does not necessarily show that employees recognize or report threats effectively.
| Metric | Definition |
| Vendor assessment coverage | Percentage of in-scope vendors completing required security reviews |
| Critical vendor findings | Number of unresolved high-impact findings associated with important suppliers |
| Vendor remediation time | Time required for vendors to address agreed security issues |
| Vendor incident-response time | Time required for a provider to acknowledge or respond to an incident |
| Dependency concentration | Degree to which critical systems rely on the same vendors or components |
Organizations define severity, incidents, remediation deadlines, and risk differently. A critical vulnerability in one environment may represent a lower risk in another because of exposure, data sensitivity, reachability, or compensating controls.
Frameworks such as the NIST Cybersecurity Framework can provide a common structure, but organizations still need internal definitions that reflect their systems and risks.
Document:
Without consistent definitions, teams may appear to disagree when they are simply measuring different things.
Automation helps security teams analyze more systems and respond faster, but automated results still require context and governance.
The Sembi Software Quality Pulse Report found that only 51% of detected security issues are true positives, creating substantial noise for security teams.
False-positive rate is therefore an important quality metric, but it should be considered alongside detection coverage. Reducing alerts by disabling useful rules would improve the false-positive rate while weakening security.
Teams should:
IBM’s 2025 research also found that organizations making extensive use of security AI and automation experienced lower average breach costs and faster resolution than organizations that did not. That result supports thoughtful automation, not unreviewed dependence on every automated output.
Security information often sits across SAST, SCA, cloud, identity, endpoint, incident-response, ticketing, and compliance systems.
The Sembi Software Quality Pulse Report found that only 9% of security teams report fully integrated toolchains with DevOps. Without integration, teams may struggle to connect a vulnerability to its application owner, remediation activity, deployment status, and business risk.
Common data problems include:
Organizations do not necessarily need one tool for every task, but they do need a consistent data model and clear system of record.
A number can be technically accurate and still lead to a poor decision when presented without context.
For example:
Security leaders should explain the scope, trend, risk, and action behind each metric rather than presenting isolated totals.
Threats, architectures, controls, and business priorities change. A metric that supported a decision two years ago may no longer be useful.
Review the metric set when:
The goal is not to retain every historical measurement. It is to maintain a set of metrics that supports current decisions.
Start with the decision the metric needs to support.
Ask:
Early-stage security programs may begin with:
More mature programs may add:
Choose a small set of useful KPIs for leadership and maintain more detailed operational metrics for the teams responsible for day-to-day work.
Metrics should reflect the organization’s most important systems, data, obligations, and business risks.
A healthcare organization may emphasize the security of systems processing ePHI. A financial institution may prioritize transaction integrity, fraud risk, resilience, and payment-card requirements. A software vendor may focus on source-code security, dependency risk, and customer-facing availability.
Avoid collecting a metric simply because a tool provides it.
A useful metric should help someone decide what to do next.
For each KPI, define:
“Twenty critical findings are open” is less useful than “Three critical findings affecting internet-facing applications have exceeded the 15-day remediation target and require owner escalation.”
A single snapshot can be misleading. Track changes over time and segment the data by risk.
Useful breakdowns include:
Trends reveal whether the program is improving, while distributions prevent averages from concealing critical outliers.
Security, development, compliance, risk, and leadership teams should review the metrics relevant to their decisions at an appropriate cadence.
Operational teams may review active findings frequently, while leadership may need a monthly or quarterly trend view. The cadence should reflect how quickly the underlying risk can change.
Use review meetings to:
Translate technical measures into potential business outcomes where the underlying data supports it.
Examples include:
Be transparent about assumptions. Financial estimates should normally be expressed as ranges rather than precise predictions.
Metrics can change behavior in unintended ways.
For example:
Pair speed and volume metrics with measures of quality, risk, and recurrence.
| Dashboard area | Example metrics | Why it matters |
| Vulnerability management | Critical findings open, findings past SLA, median remediation time | Shows whether important security issues are being resolved |
| Incident response | MTTD, MTTA, MTTC, recovery time, incident severity | Measures detection, response, containment, and recovery |
| Application security | SAST coverage, policy-gate results, recurring vulnerabilities, production escapes | Shows whether risky code is being identified before release |
| Open-source risk | Vulnerable dependencies, unsupported packages, license-policy violations | Tracks third-party and software supply chain exposure |
| Identity and access | MFA coverage, dormant accounts, access-review completion | Measures access-control implementation and oversight |
| Compliance | Open audit findings, exceptions, control status, training completion | Supports governance and audit preparation |
| Business risk | High-risk assets, estimated incident impact, critical service downtime | Connects security work to business consequences |
Use separate views for different audiences. Engineers need enough detail to act on findings, while executives usually need trends, material risk, ownership, and investment implications.
Cybersecurity metrics only matter when teams can connect them to evidence and action.
Kiuwan Code Security provides static application security testing for proprietary code. It helps teams identify and prioritize vulnerabilities, analyze code during development, and review findings through supported IDE and CI/CD workflows.
Teams can use SAST data to support metrics such as:
Kiuwan Insights provides software composition analysis for third-party and open-source components.
Its data can support metrics such as:
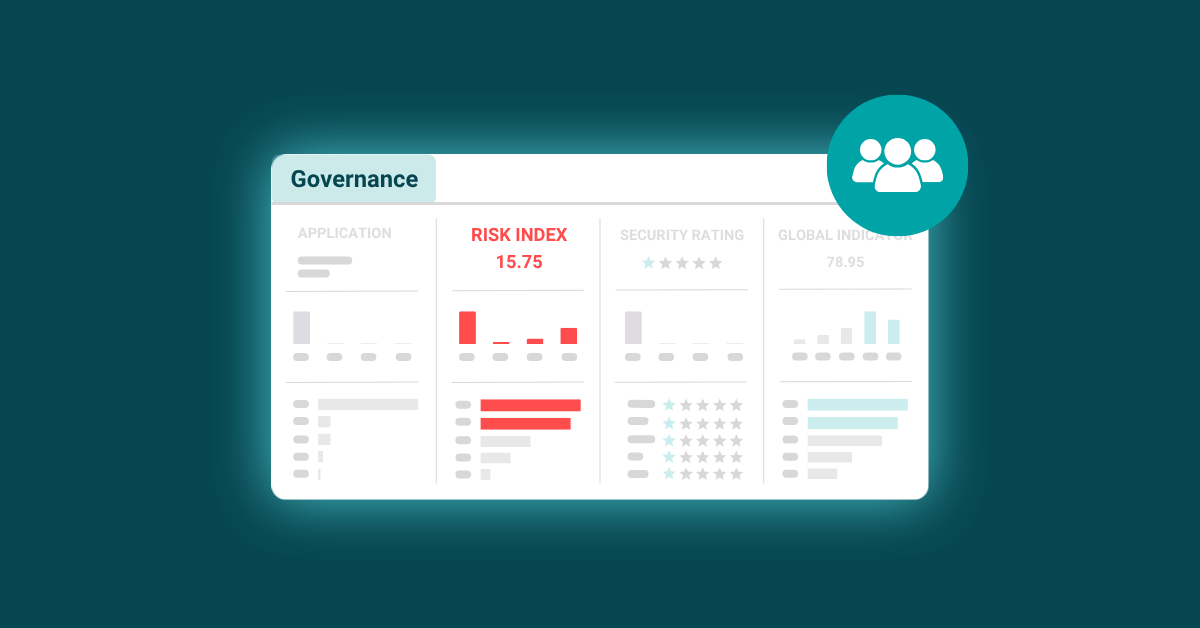
Kiuwan Governance brings application-analysis data, trends, and portfolio insights together for broader reporting. This can help leaders compare applications, review policy status, and identify areas that require additional attention.
These capabilities do not measure every part of an enterprise cybersecurity program. They focus on code security, open-source risk, code quality, and application-level governance within the development lifecycle.
Cybersecurity metrics are not merely numbers for a dashboard. They should help teams identify risk, assign responsibility, prioritize remediation, evaluate controls, and make better investment decisions.
Begin with a focused set of measurements tied to business objectives. Define each metric consistently, assign an owner, set an action threshold, and review trends over time. Expand the program only when additional measurements support a clear decision.
Kiuwan combines SAST, SCA, code-quality analysis, and portfolio-level reporting to help DevSecOps teams measure and improve application security throughout development.
Start your free 14-day Kiuwan trial to evaluate security findings, open-source risk, remediation trends, and policy status across your applications.
Cybersecurity metrics are data points used to measure security activity, exposure, control coverage, and program performance. They help teams identify risk, track remediation, and evaluate whether security processes are improving.
A cybersecurity KPI is a metric tied to a defined strategic objective, target, or threshold. It helps an organization determine whether its security program is progressing toward a specific goal.
Metrics measure security activity or performance. KPIs are selected metrics connected to strategic goals.
For example, the number of vulnerabilities identified is a metric. If the organization’s goal is to remediate 95% of critical vulnerabilities within 15 days, the percentage resolved within that period becomes a KPI.
Metrics can connect security activity to financial exposure, operational disruption, regulatory risk, and remediation needs. Measures such as incident cost, service downtime, Annualized Loss Expectancy, and risk reduction can provide evidence for investment decisions when the underlying assumptions are documented.
Cybersecurity metrics provide visibility into security performance and risk. They help organizations prioritize work, assign resources, support audits, communicate with stakeholders, and measure improvement.
Cybersecurity metrics generally fall into three broad categories:
• Operational metrics measure day-to-day security performance.
• Compliance metrics track requirements, controls, and evidence.
• Risk-based metrics connect security exposure to likelihood and business impact.
Common challenges include inconsistent definitions, false positives, siloed tools, incomplete coverage, outdated metrics, poor data quality, and stakeholder misinterpretation.
Kiuwan supports application-security measurement rather than every area of enterprise cybersecurity.
Kiuwan Code Security provides SAST data for proprietary-code risk, while Kiuwan Insights provides SCA data for open-source vulnerabilities and licensing concerns. Kiuwan Governance adds portfolio-level reporting and trends. Together, these capabilities can support application-security coverage, remediation, policy, dependency, and governance metrics.