New Analysis
There are two possibilities to analyze the application code: uploading the source code to Kiuwan server or analyzing it on a local machine, if we have previously downloaded and installed the downloadable agent.
A reasonable use of the service does not require to analyze an application more than once a day, but you can analyze any application as much as you need within the limits of your subscription.
...
Code Analysis in the cloud
The data needed to launch a new analysis are provided in a single screen:
...
What you need, in order to analyze the application code, is:
...
...
...
- find it again later.
Analyze your source code
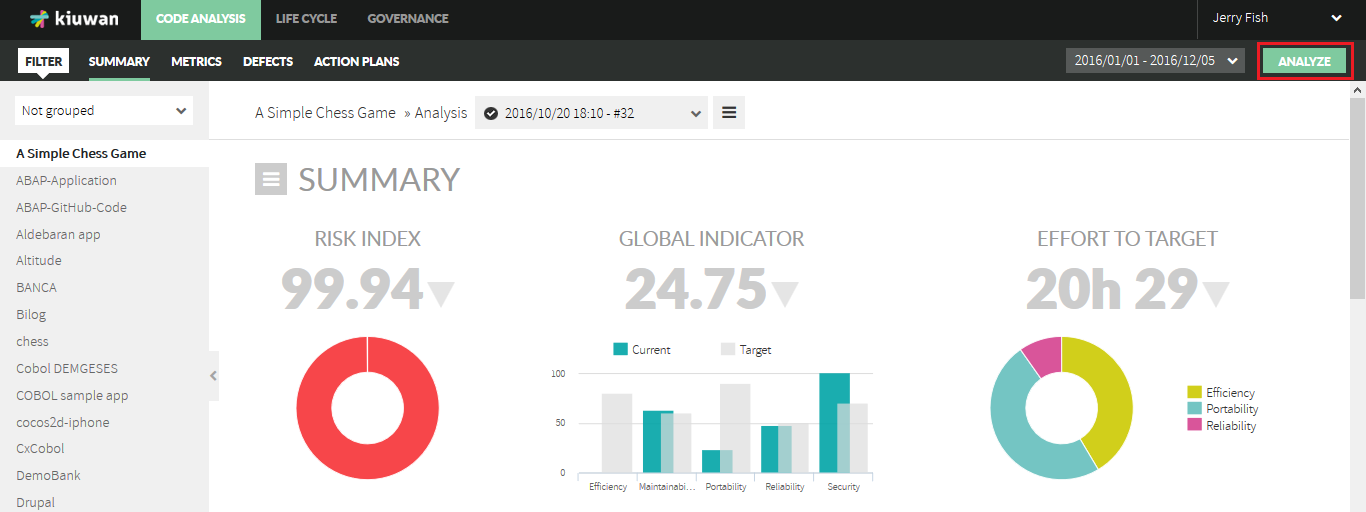
Log into your Kiuwan Account
- On your dashboard, click Analyze in the upper right corner
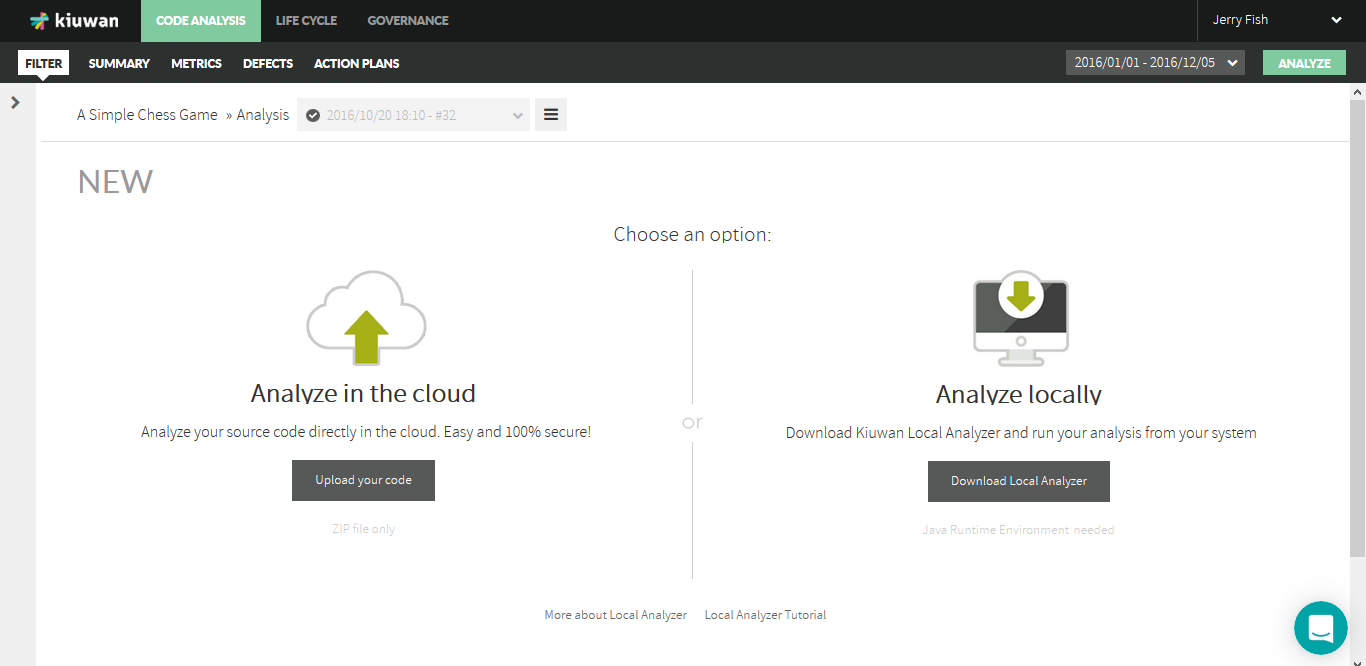
- A new page will open.
Click Upload your code in the Analyze in the cloud section.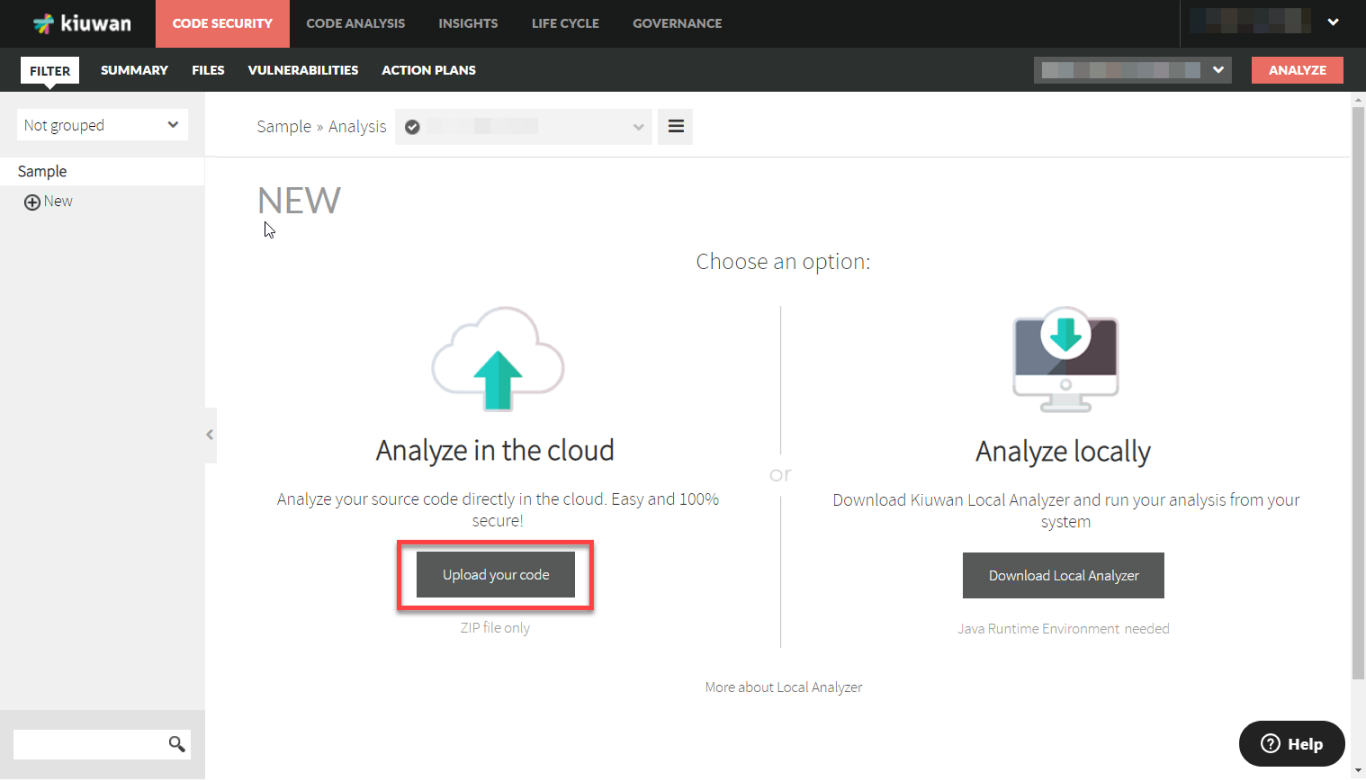
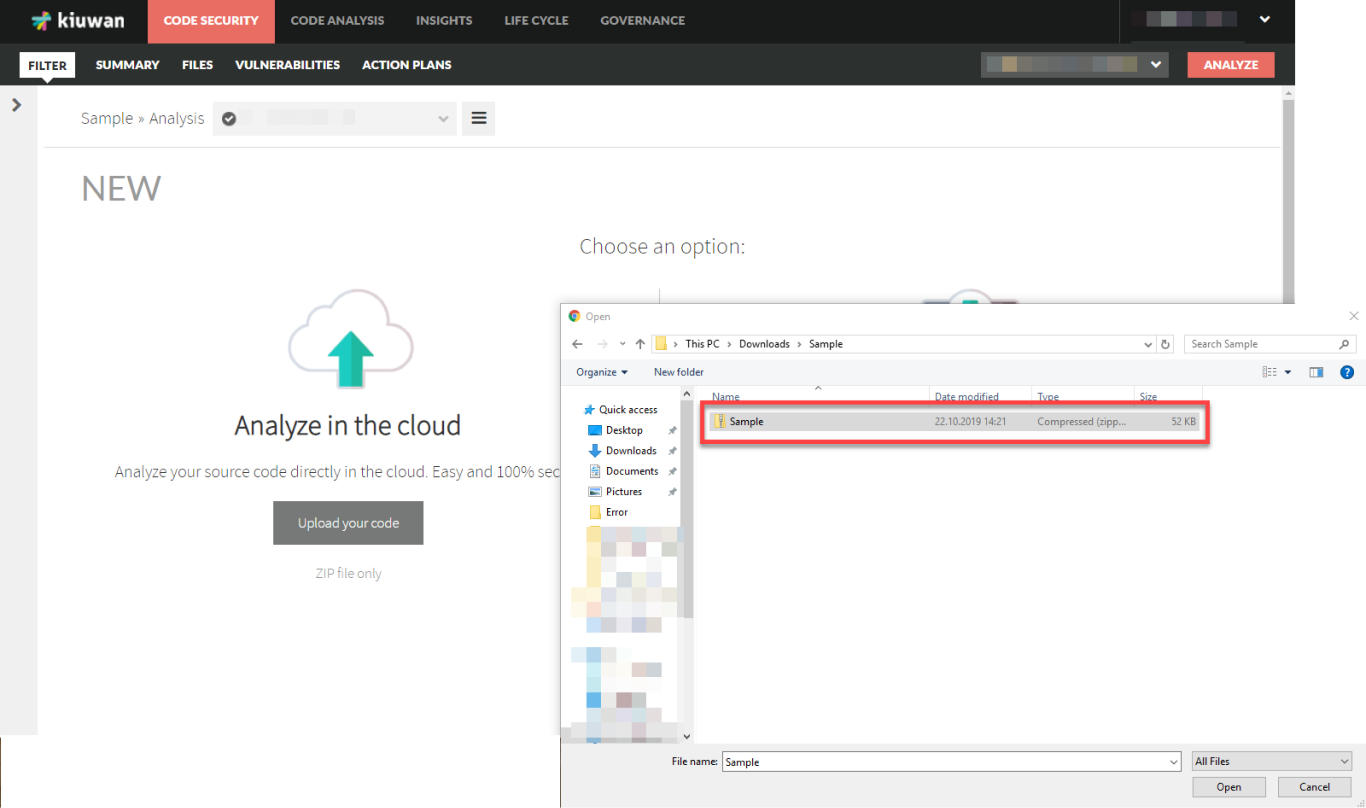
- Find and select the Zip file of the code you want to analyze.
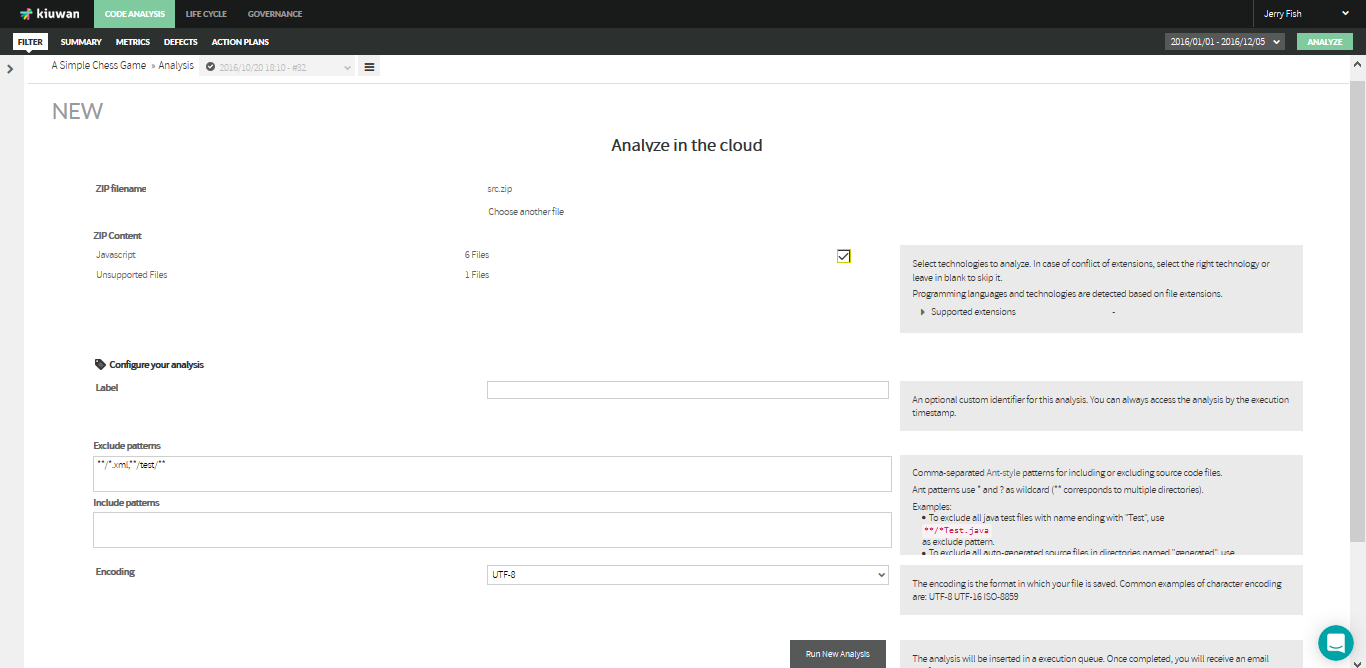
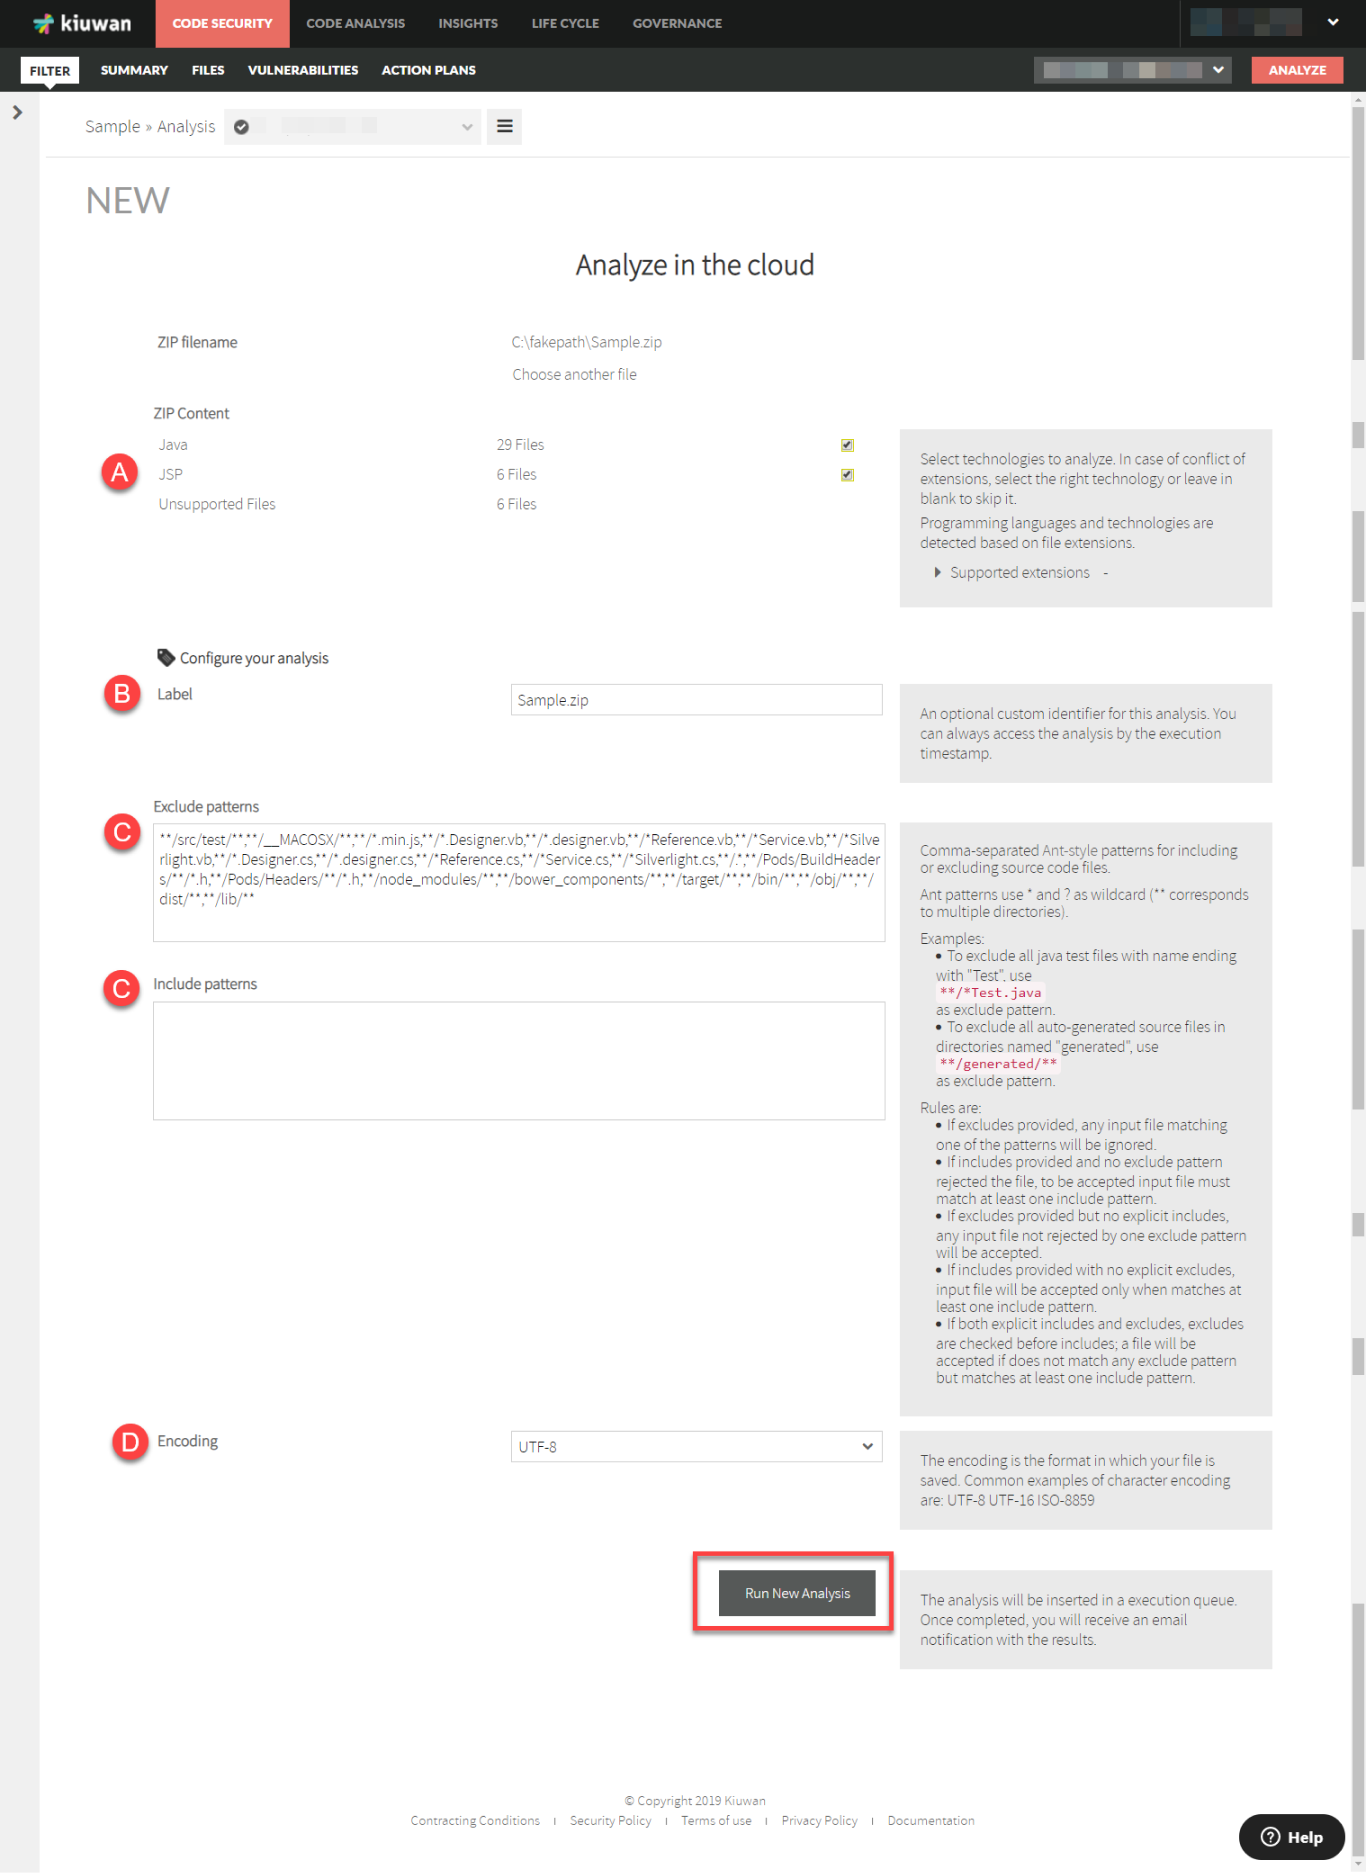
- On the next page you can set the analysis criteria:
- Choose which extension files to analyze
- In case of an extension file conflict, you will have to choose the right extension in the dropdown menu.
- Label the analysis
- Include or exclude patterns
- Choose the type of encoding
- Choose which extension files to analyze
- The analysis is executed
- See the results of your latest analysis.

In case of an extension file conflict, you will have to choose the right extension in the combo menu.
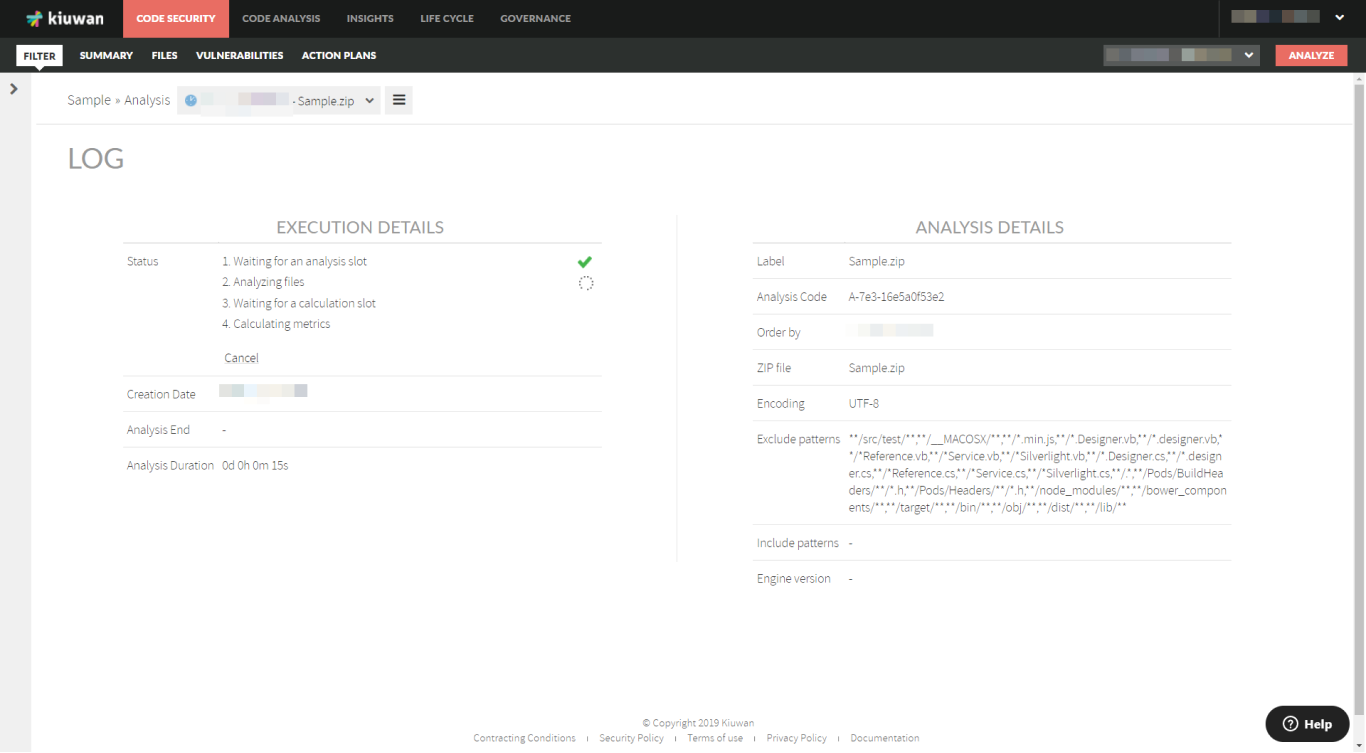
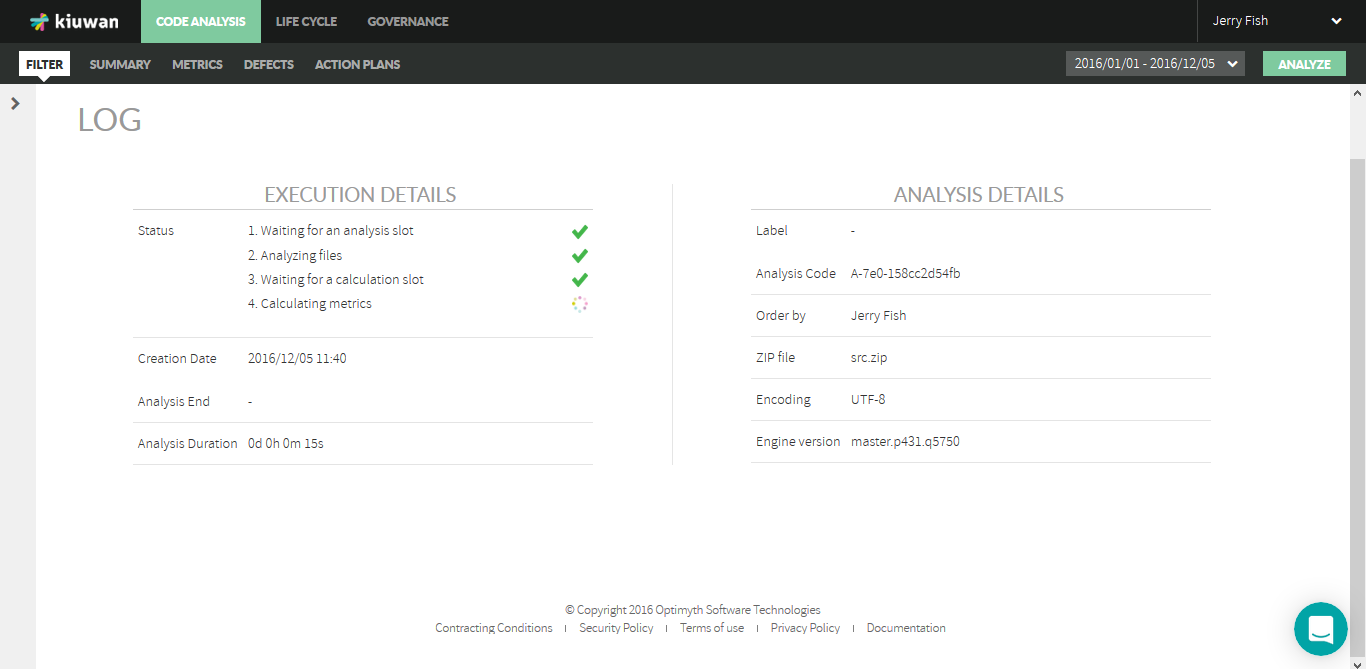
Once you press the button "Run New Analysis", you will be directed to the Log screen, where you can continue the execution, until its completion, when Kiuwan takes you back to the analyzed application Dashboard.
Local Code Analysis
In case you decide to run the Analysis locally at your machine, click on Download Local Analyzer button to download it and follow innstructions at Kiuwan Local Analyzer on how to install and use it.
Looking at the Analysis Log
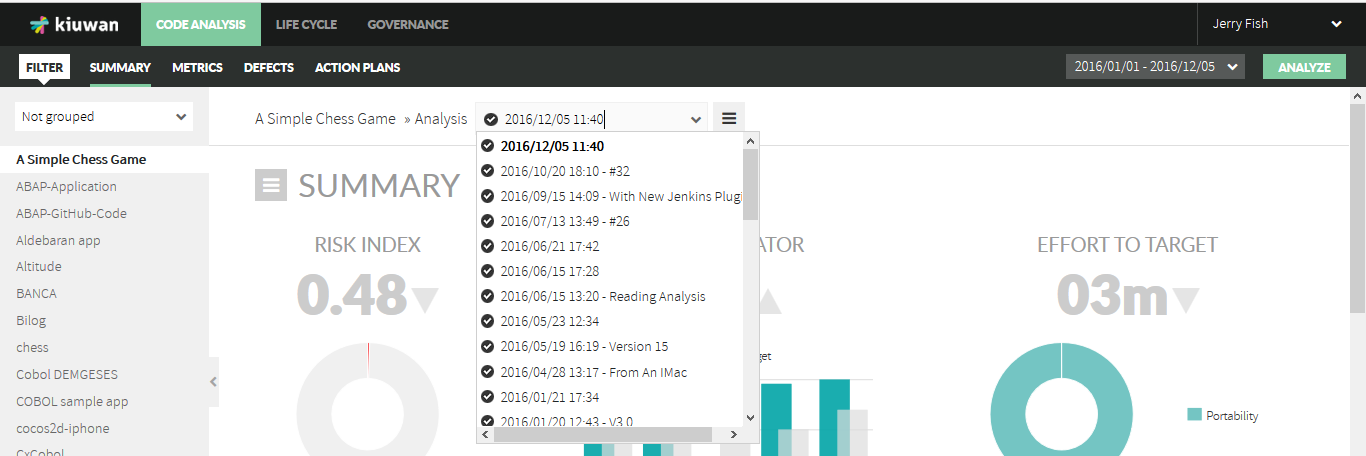
Whether you run your analysis locally or in the cloud, using the combo in the menu bar you can pick the analysis of the selected application, for which you want to view its results:
Clicking on the Log icon in the vertical menu, you can get the details of this analysis, as shown in the following screen:
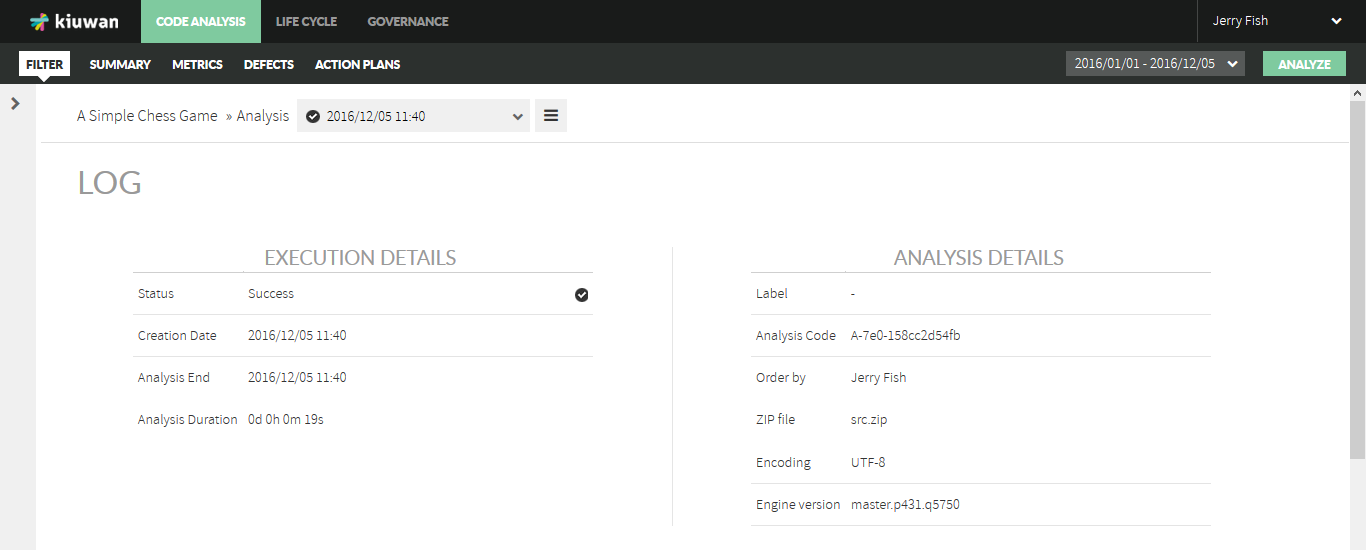
In the analysis fails, Status field will show an Error Code that you can inspect at Analysis Error Code Reference
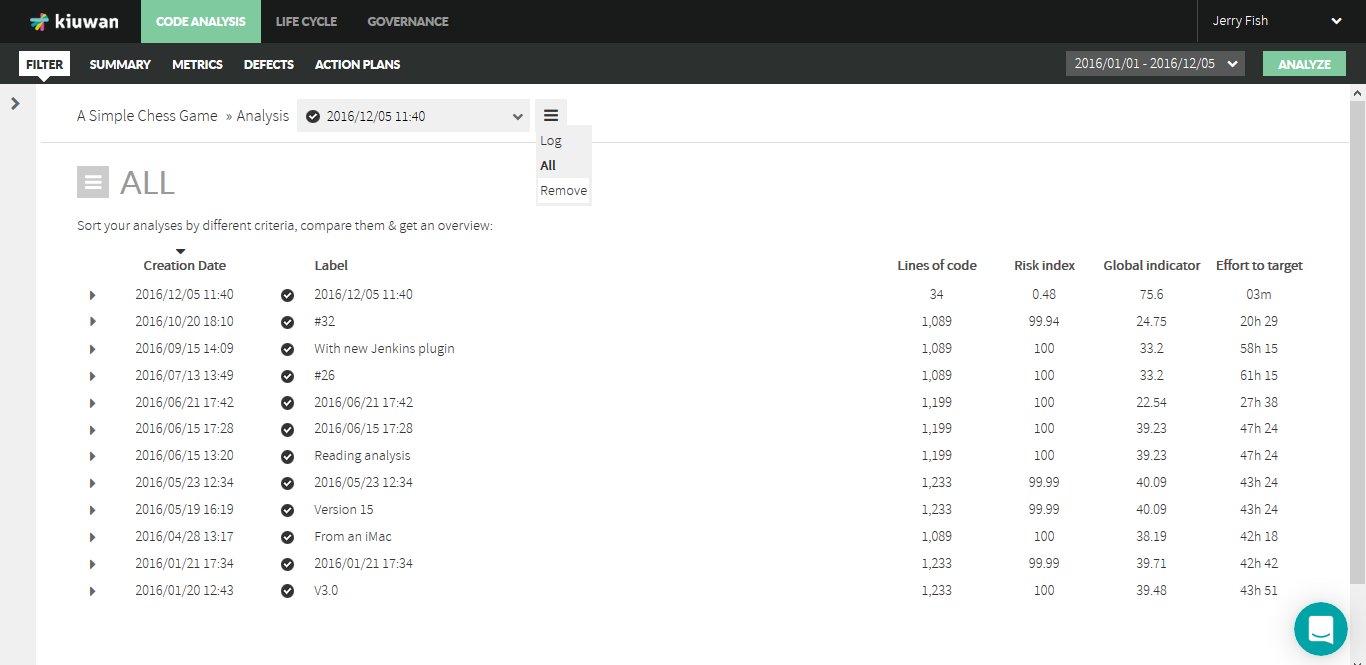
"All" view
Clicking "All" button in the vertical menu near to the top right corner of the page, we will see the complete list of all the analyses we have run on the selected application. If we want to change the selected application, we will have to deploy de left menu by clicking on the purple arrow on the top left side and, then, choose the application whose complete list of analyses we want to see.
...
By default, the list is sorted by date, but we can change this sorting criterion by clicking on the column header we want: label, lines of code, risk index, quality indicator or effort to target.
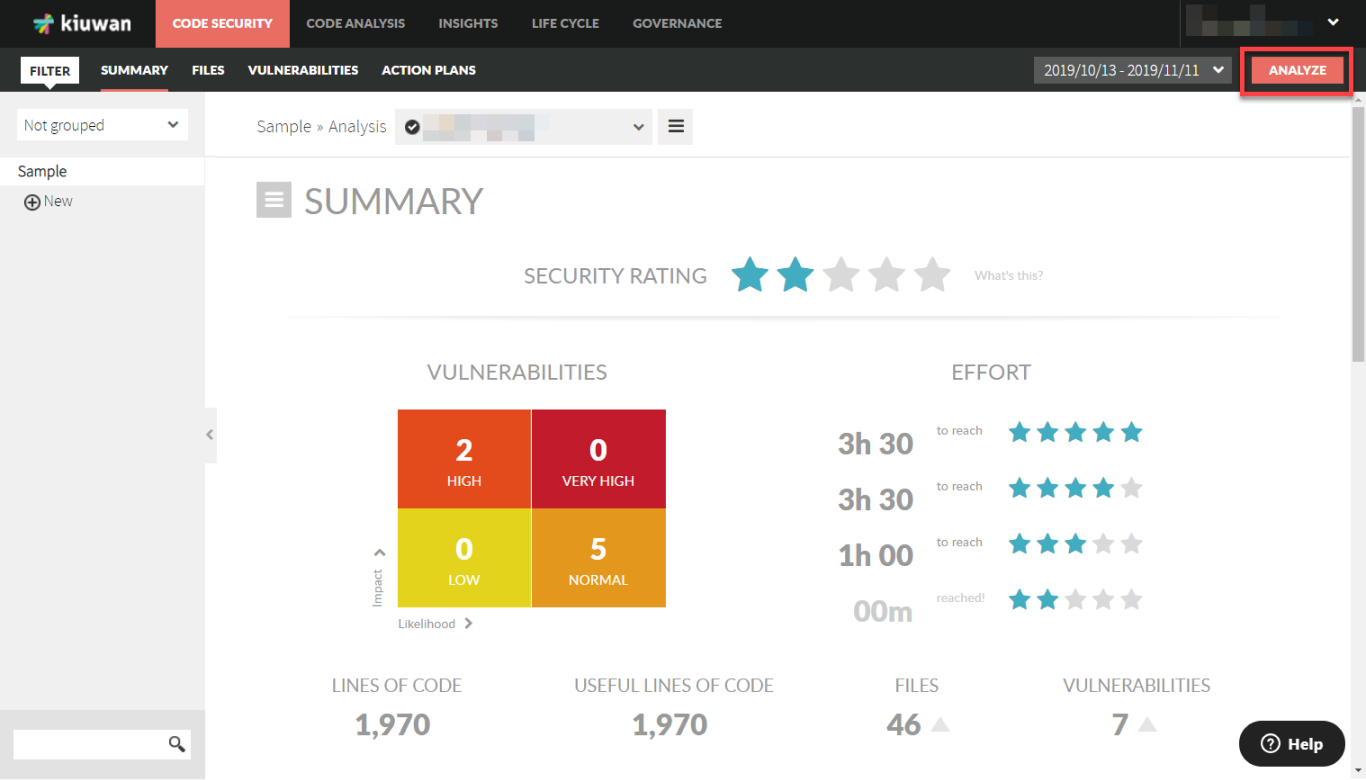
If we click on a specific analysis, a dashboard will be displayed, showing us useful data, such as:
- The number of files in that application.
- The lines of code that application has.
- The values of the quality main indicators:
- Effort to target
- Quality indicator
- The position of that application in the ranking, depending on its quality value.
- The distance to the top, measured in quality.
- The date of the last analysis run.
- The quality model used in that last analysis.
- The value of the complexity by function.
- The number of defects found and the number of the ones muted, if any.
- The duplicated code ratio.
- The graphing of the quality main indicators mentioned above.
The graphing of the distribution in languages of the lines of code.
Removing an Analysis
If we want to remove an analysis data, it can be done by selecting Remove option from the Menu Bar, which will ask for confirmation before proceeding. Thereafter, this analysis does not appear in the application metrics timeline diagrams.
...