Problem
Some JVM implementations try to allocate the memory.max value at start-up time. If your machine could not allocate that amount of free memory, the JVM will not start and therefore the Kiuwan analysis will fail.
In this case, you will be presented with the same error message as in Out of Memory.
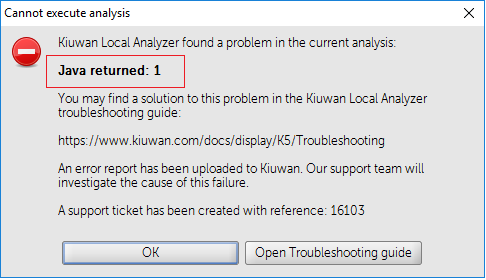
Click Analyzer log to open a window where the log file (temp/agentGUI.log) is displayed. Here you will see the following error message:
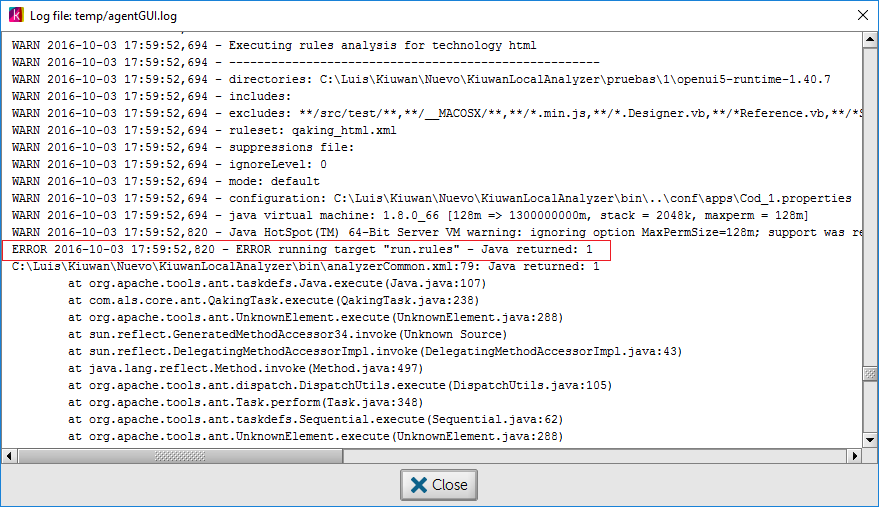
You will find some lines as the following indicating that a JVM has exited with error 1.
ERROR 2016-10-03 17:59:52,820 - ERROR running target "run.rules" - Java returned: 1
C:\Luis\Kiuwan\Nuevo\KiuwanLocalAnalyzer\bin\analyzerCommon.xml:79: Java returned: 1
Most of the time, this indicates that the operating system is not able to allocate the configured memory to the JVM process.
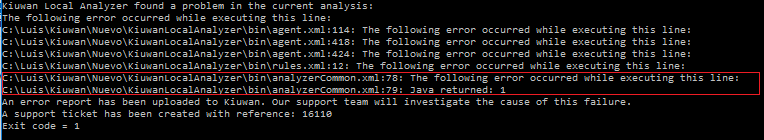
If you are using Kiuwan Local Analyzer in CLI mode, this error is reported to the standard output.
Solution
To solve it,
- Try stopping processes in your local machine (to free memory)
- Configure Kiuwan max.memory to a lower value (visit Out of Memory for help on how to change memory-related parameters)
If your problem persists, please contact Kiuwan Technical Support.
Sometimes this error appears when you are using 32-bits Java VM and you are allocating more than 1GB. In this case, use 64-bits JVM instead of 32-bits.
If you are not sure what version you are using, please run the following command:
java -version
Related articles