On the screen "Application -> Metrics", you can see the following information:
The metrics are classified by the different groups of applications. By expanding each application, you will see the different metrics for the selected application: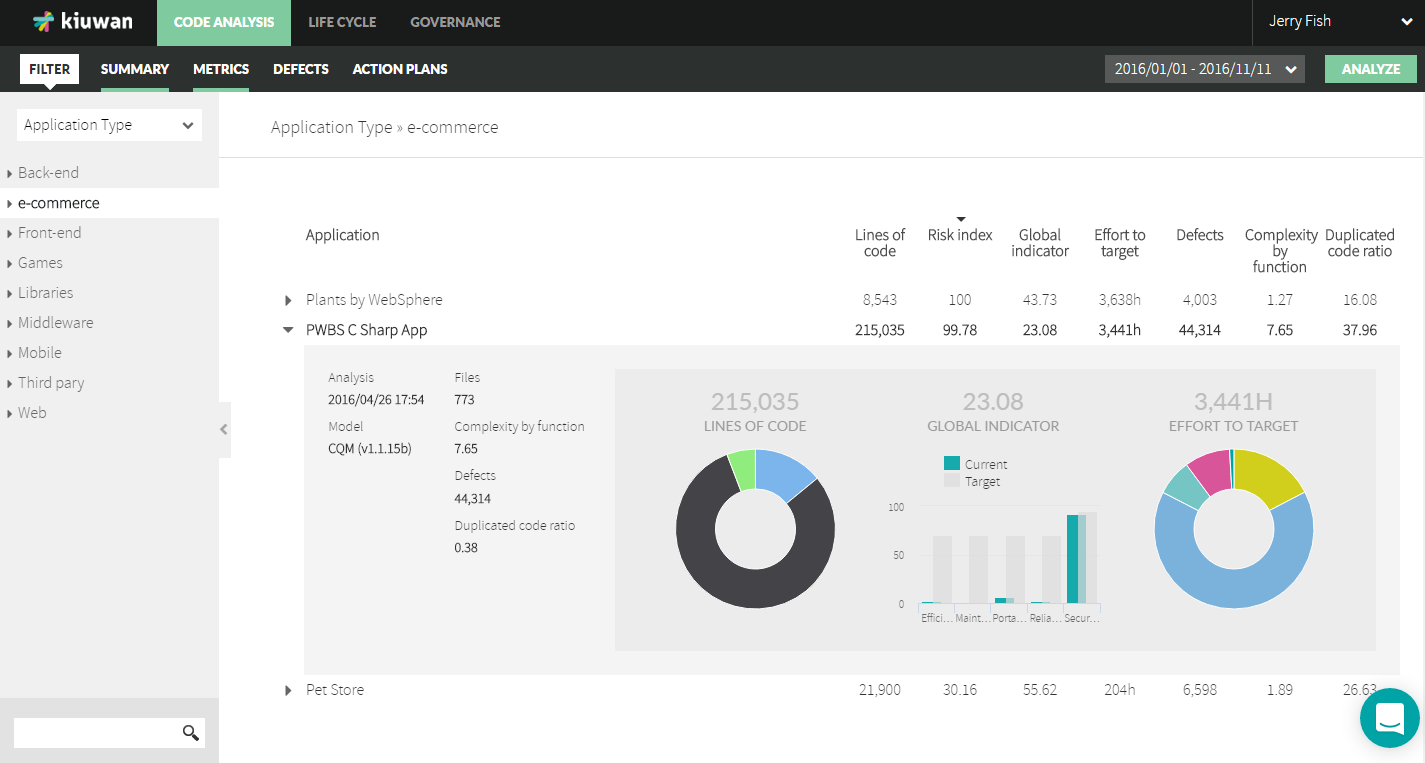
Where the left panel shows:
- The portfolios tree, that you can explore expanding and collapsing nodes.
The top of the central panel shows, for the applications group selected in the tree at the left:
- The main indicators for the selected application.
- The metrics of that application or group of applications: lines of code, risk index, global indicator, effort to target, defects, complexity by function and the duplicated code ratio.
- Additional information of the selected application or group of applications, such as: the analysis date, the software model used for that analysis, the number of files, etc.