Contents:
Related pages:
KOP Administrators
There are two KOP "administrators"
- sysadmin
- access to KOP sysconsole, with functionalities related to monitoring and tuning KOP execution
- kiuwanadmin
- access to Kiuwan "functional" administration modules such as Users, Applications and Model Management (see Admin Guide )
This System Administration Guide is addressed to sysadmin user.
Please refer to Admin Guide for Kiuwan functional administration guide.
SysAdmin Console
SysAdmin Console
System administration user (sysadmin) has access to Sysadmin Console :
http://<$KIUWAN_HOST>:<$KIUWAN_PORT>/saas/web/sysadmin
Sysadmin console provides access to following functionalities:
- Queues management
- Support logs
- Memory usage
- Purge tasks
Support
Support Module allow s to collect most important log files of KOP installation for troubleshooting purposes.
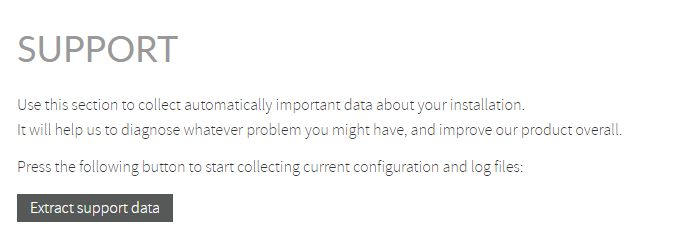
By clicking on Extract support data, you will obtain a zip file with most relevant log files.
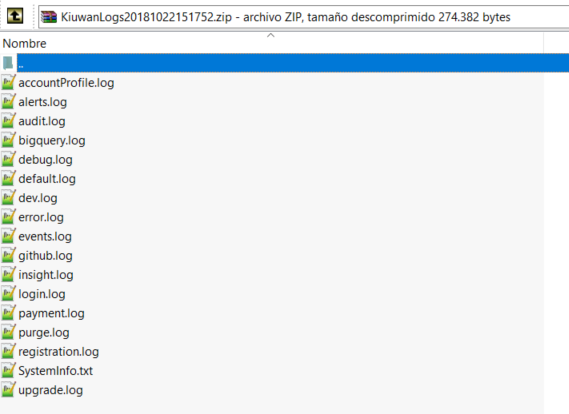
Siempre están en : /kiuwan_vol/logs/cinc/logs
| Logfile | Content | comentario |
|---|---|---|
| accountProfile.log | no se necesita | |
| alerts.log | no se necesita | |
| audit.log | logs de creacion/borrado de entidades de kiuwan | mantener |
| bigquery.log | no se necesita | |
| debug.log | no se necesita | |
| default.log | ????? (es el cinc.out??) | aclarar su contenido |
| dev.log | contiene trazas de las colas | revisar |
| error.log | ???? (es el cinc.error??) | aclarar su contenido |
| events.log | esto es del kibana | quitarlo |
| github.log | esteo es del github | quitarlo |
| insight.log | log del insights | mantener |
| login.log | intentos de login fallidos | quitarlo |
| payment.log | quitarlo | |
| purge.log | log de purgados | mantener |
| registration.log | no se usa | quitarlo |
| SystemInfo.txt | system info | mantener |
| upgrade.log | algo del QMM | quitarlo |
Queue Management
A complete Kiuwan analysis involves two-phases:
- 1st Phase - Local Analysis
- KLA analyzes source files and upload reports to Kiuwan
- 2nd Phase - Cloud Metrics Calculation
- Indicators and metrics are calculated in the cloud based on uploaded analysis reports
KOP uses an in-memory message queue to process those reports. This message-based queue ("Reports generated queue") allows to process (and manage) analyses in an ordely fashion
Messages in this queue are processed by a JVM (executing WildFly and KOP application).
By default, the queue is attended by one thread in the KOP JMV.
This means that, by default, analyses are sequentially processed.
States of an analysis
Once local analysis finishes, KLA upload reports to KOP and identifies the analysis by an Analysis Code (e.g. A-7e2-1669fcae0cf).
Then, the analysis could be in either of two possible states:
| Analysis State | Meaning |
|---|---|
| STATIC_ANALYSIS_FINISHED | (1) The local static analysis is finished and results are waiting to be processed (to calculate indicators) |
PARSING_REPORTS | (2) The analysis reports are currently being processed (in progress) |
Messages in the queue
Queue monitor displays the number of messages in the Reports Generated Queue.

This means the number of analyses waiting to be processed.
If this number is constantly greater than 0, that means that there's a bottleneck and you (as sysadmin) should increase the throughput to avoid waiting states.

As said above, by default the KOP JVM listen to the message queue with 1 thread. You can configure the max number of threads by introducing an upper value and click on Change button.
Also, you can stop processing by clicking on Stop button.
Active Analyses
By clicking on Active Analyses button, the queue monitor will display ALL the active analyses, regardless of their state (STATIC_ANALYSIS_FINISHED and PARSING_REPORTS).
REPORTS_GENERATED_QUEUE
By clicking on REPORTS_GENERATED_QUEUE button, the queue monitor will display only the analyses waiting to be processed (i,e STATIC_ANALYSIS_FINISHED).