...
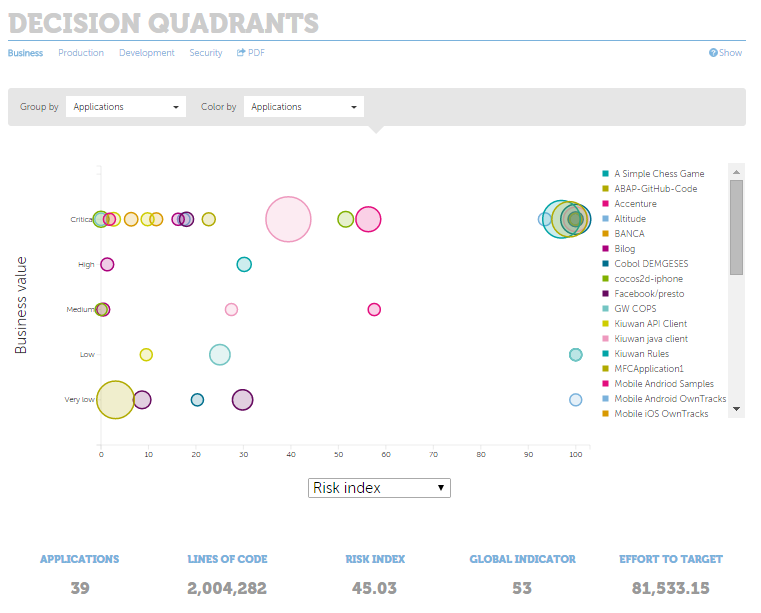
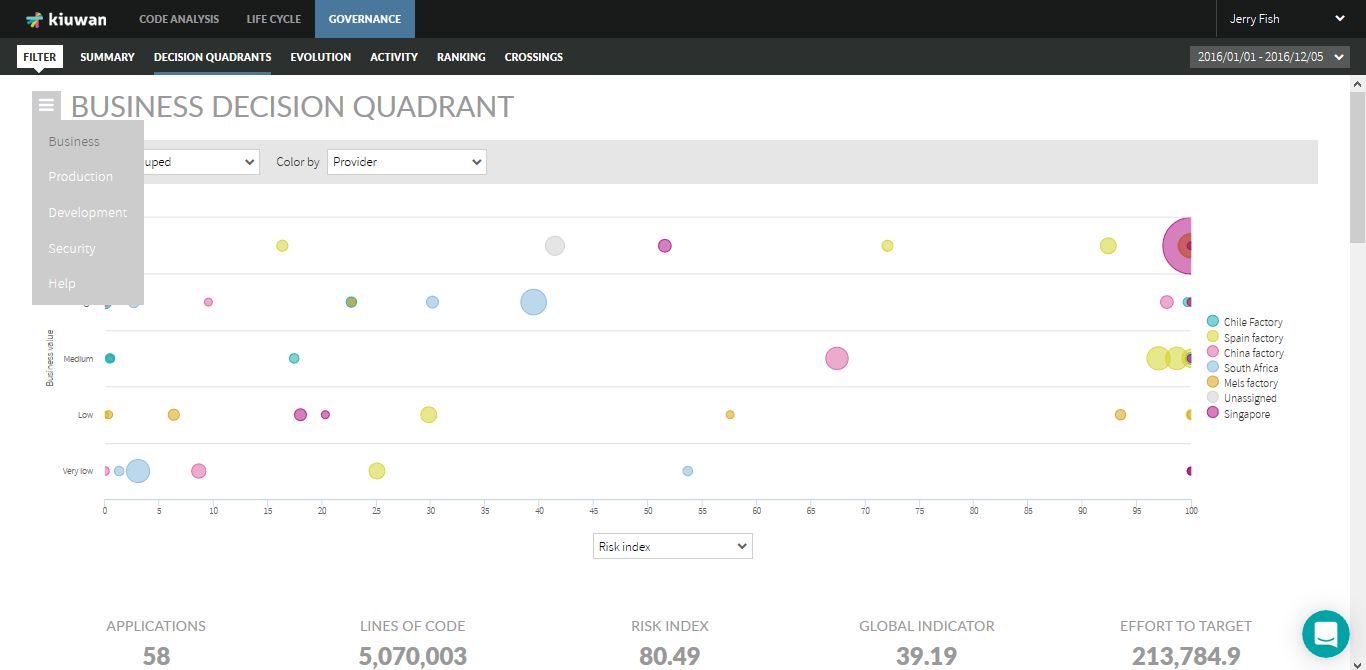
- Global Risk (risk index): This index combines the application quality (taking into account all software characteristics), the effort to repair based on the target for each application and the application size. If the risk index is high you should invest in quality (redesign) the application.
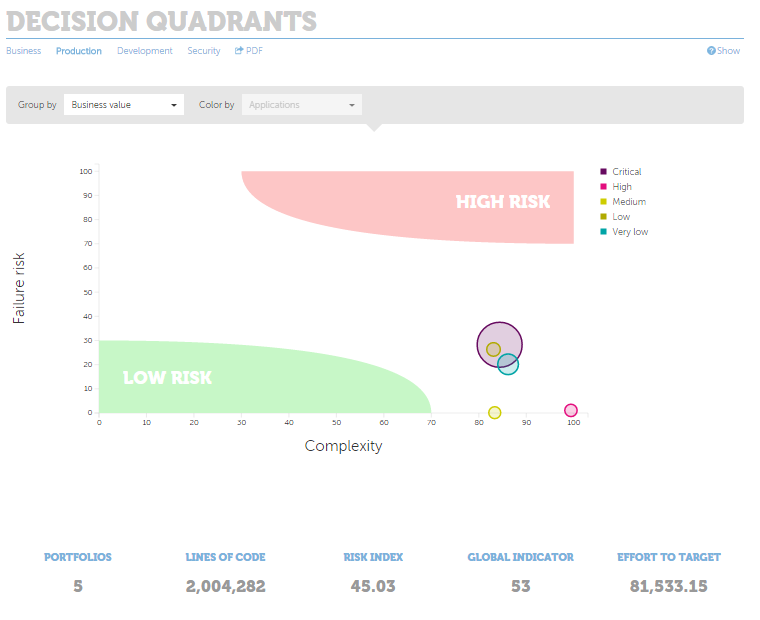
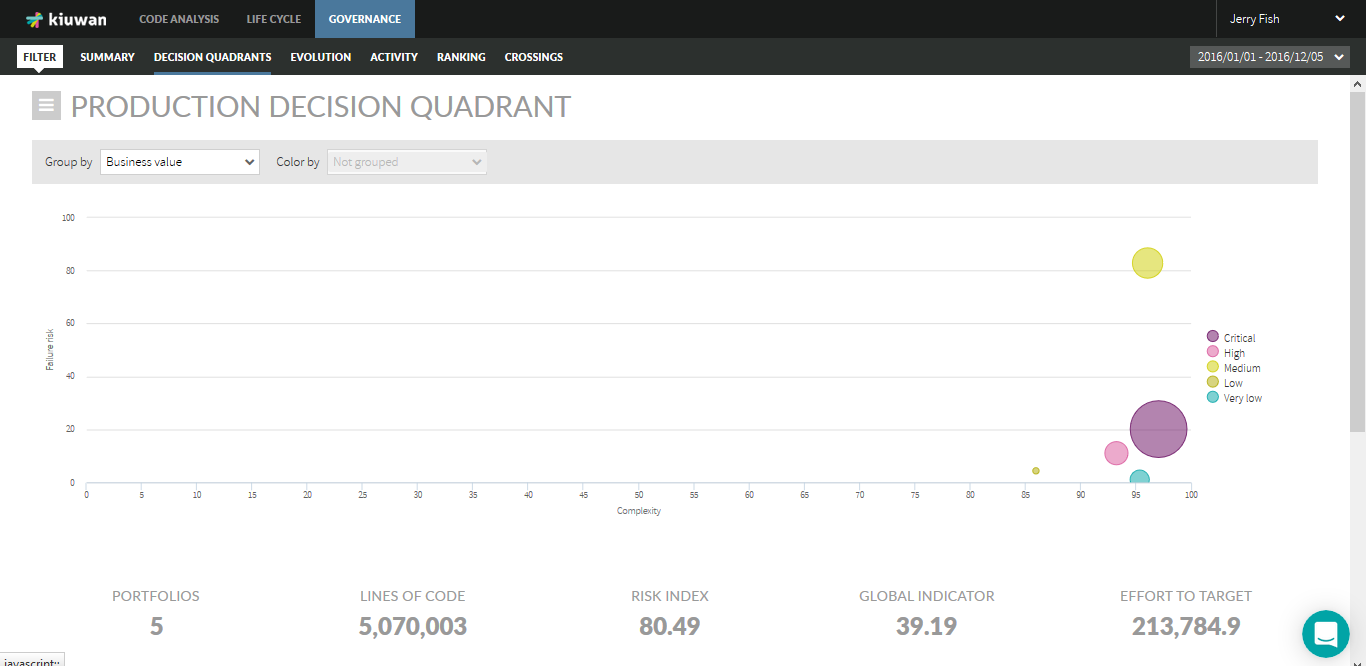
- Failure Probability (Production Risk): This indicates if applications are likely to provoke frequent errors in production. Applications with high Failure Probability could be a problem in the short term.
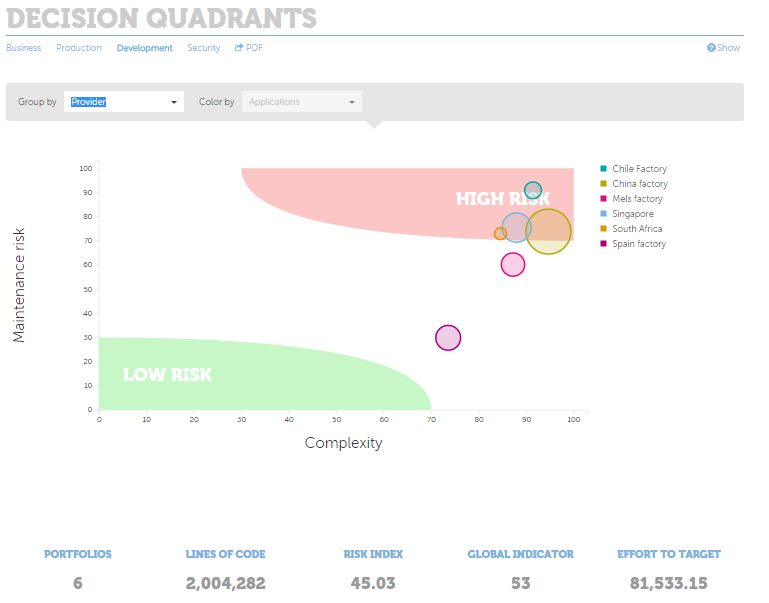
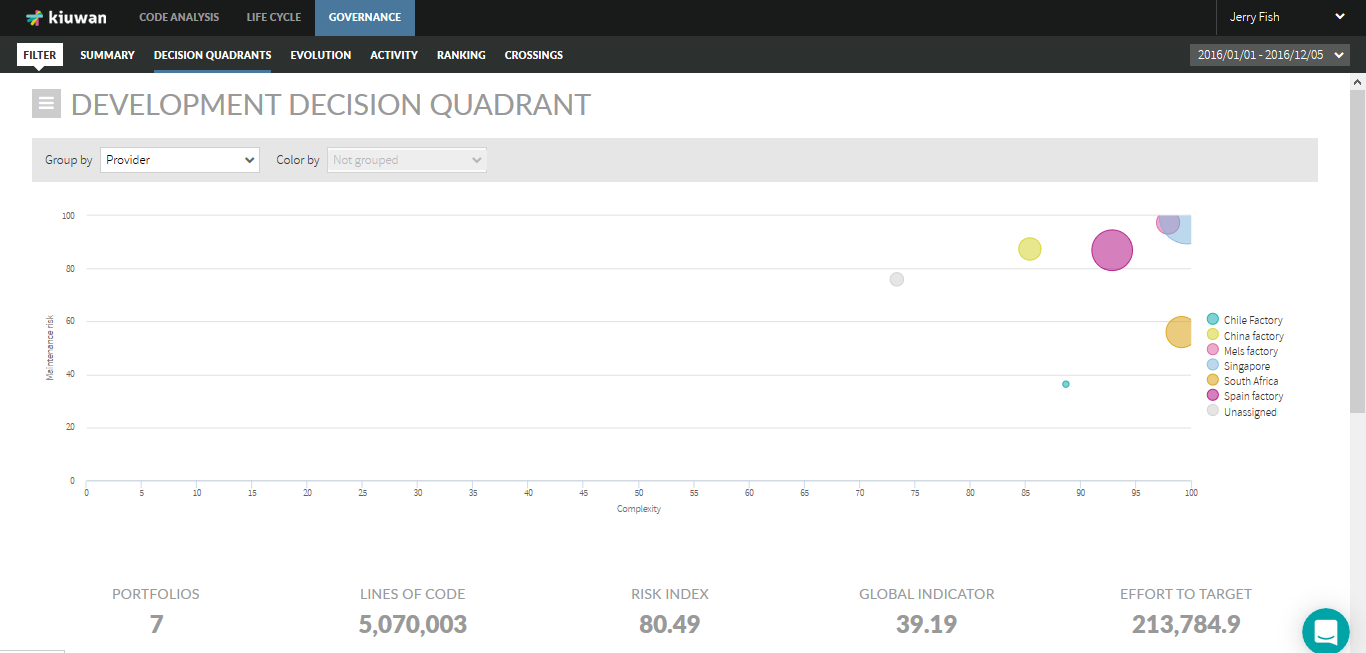
- Maintenance Risk: This tells you if applications’ maintenance costs are going to be higher than expected, or if it is going to be complex and costly to add new functionality to them. If the Maintenance Risk is high it could be a problem in the midterm.
- Security Risk: This indicated how vulnerable an application is to internal or external attacks based on the number of vulnerabilities found in the application’s code as listed by CWE and OWASP. A high Security Risk indicates that applications have more exploitable vulnerabilities that can yield to security breaches of all kinds.
Production
The Production quadrant is aimed to identify those applications in your portfolio that could cause problems in production, and if they will be able to recover from these errors easily. The applications with higher exposure to this kind of risk will be those in the upper-right area of the quadrant.
...
In the horizontal axis we represent application Complexity, a normalized (between 0 and 100) metric based on applications’ cyclomatic complexity by function, duplication of code and maintainability index.
Development
The Development quadrant is aimed to identify those applications in your portfolio exposed in the midterm given the difficulty and associated cost to maintain them. The applications with higher exposure to this kind of risk will be those in the upper-right area of the quadrant.
...
In the horizontal axis we represent application Complexity, a normalized (between 0 and 100) metric based on applications’ cyclomatic complexity by function, duplication of code and maintainability index.
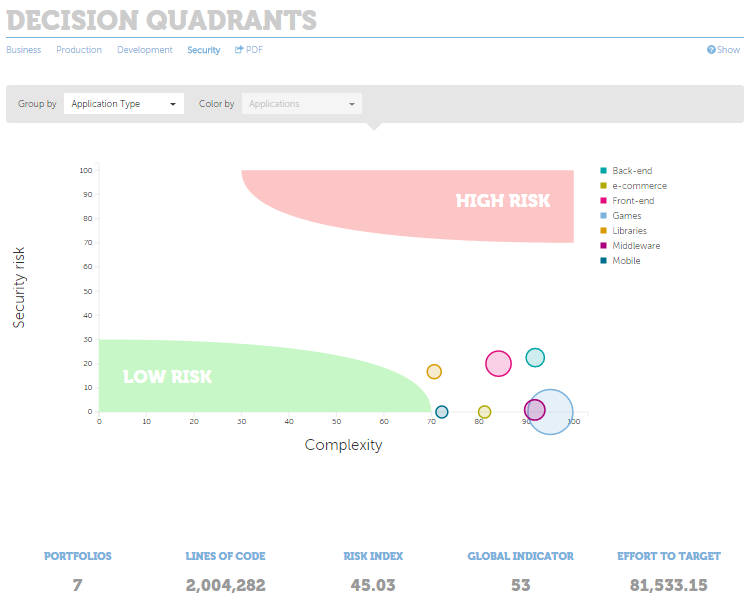
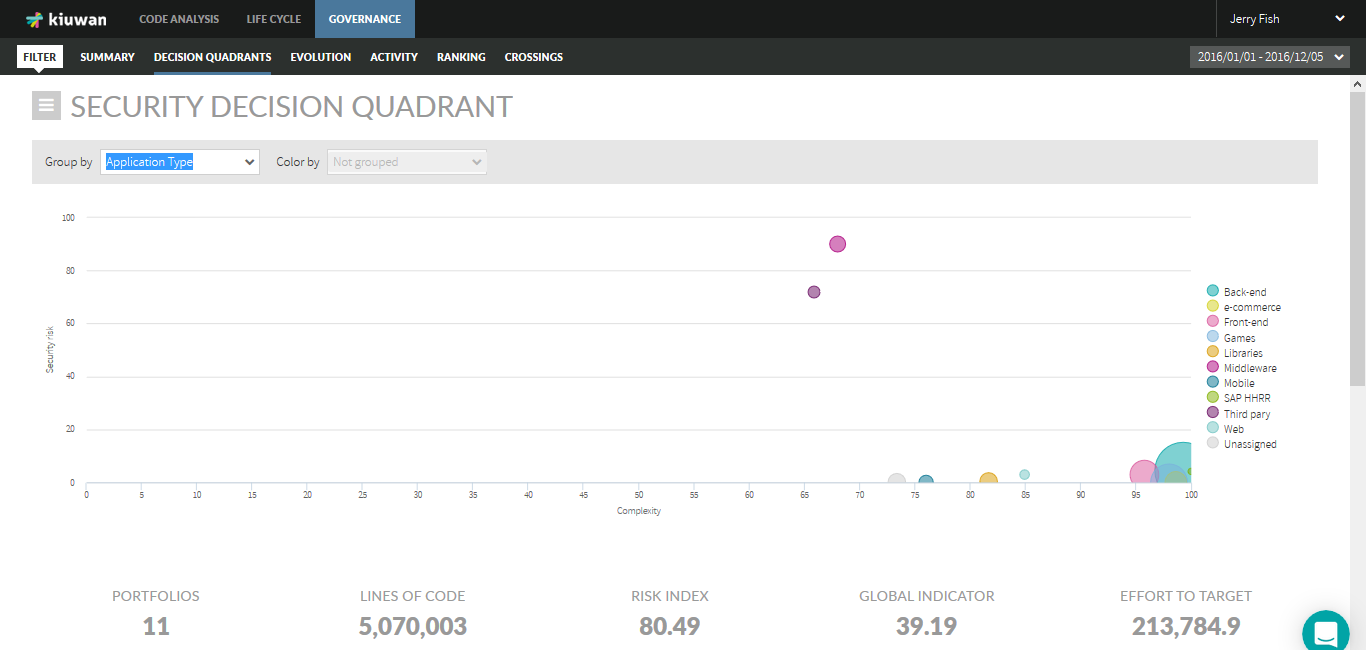
Security
The Security quadrant is aimed to identify those applications in your portfolio that are exposed to potential internal or external attacks, that can compromise the integrity of you organization, and if these potential vulnerabilities can be easily corrected. The applications with higher exposure to this kind of risk will be those in the upper-right area of the quadrant.
...
In the horizontal axis we represent application Complexity, a normalized (between 0 and 100) metric based on applications’ cyclomatic complexity by function, duplication of code and maintainability index.