...
Summarized Global Indicator is calculated as a average of Global Indicators (weighted by App`s Size) of selected apps.
Global Distribution of Applications
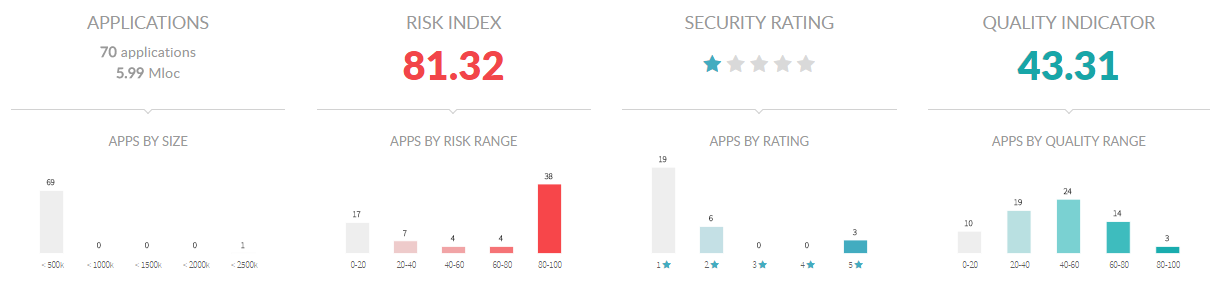
Besides summarized indicators, Governance Summary also provides a distribution of your account's applications according following criteria.
Apps By Size
Histogram displaying the distribution of apps (frequency) according to 5 size ranges.
Apps By Risk Range
Histogram displaying the distribution of apps (frequency) according to 5 ranges for Risk Index:
- 0-20
- 20-40
- 40-60
- 60-80
- 80-100
Apps By Sec Rating
Histogram displaying the distribution of apps (frequency) according to Security Rates
- 0-20
- 20-40
- 40-60
- 60-80
- 80-100
Please note, that this distribution is based on original apps security rates. So you could find that, for example, most of your apps have 3 stars but the Summarized Security Rating is 1.
This is due to the algorithm applied to Summarized Security Rating calculus.
Please remember that Summarized Security Rating is not an average !! It's calculated based on a greatest common divisor (gcd) approach of the security ratings of the selected applications. For example, If you have 3 apps with 5-, 4- and 1-star respectively, you Global Sec Rating will be 1-star.
Apps by Global Indicator
Histogram displaying the distribution of apps (frequency) according to 5 ranges for Global Indicator
- 0-20
- 20-40
- 40-60
- 60-80
- 80-100
Grouped By Aggregated data
Besides Summarized indicators (as shown above), you can select how to group aggregated data-
Based on the selected portfolio