In this guide, you will learn how to debug the custom rules you have created with the Kiuwan Rule Developer.
Contents:
Why do I need to debug my rules?
Sometimes you need to perform complex checks and take into account multiple cases of how code should be constructed or which best practices it should follow.
Although Kiuwan offers a complete API reference (bundled with Kiuwan Rule Developer), it's not always possible to predict how rules will behave when executed in non-trivial scenarios.
Debugging a complex rule fine-tunes its behavior, making the rise of spurious defects less likely to happen.
Spurious defects
A false positive is introduced in an analysis result when a defect arises, although it shouldn't.
A false negative is introduced in an analysis result when a defect that should arise does not arise.
Set up the debugger tool
Kiuwan Rule Developer allows you to remotely debug the rule you are editing in your IDE while it is being executed.
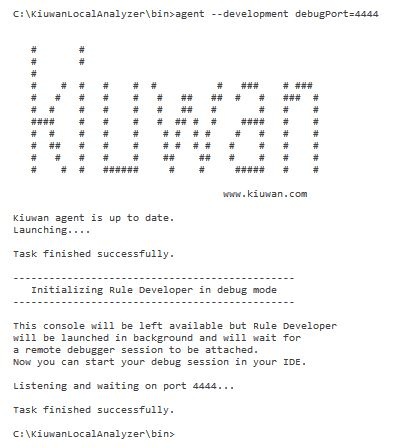
To start, launch Kiuwan Rule Developer in debug mode.
Open a console and type:
| OS | Command |
|---|---|
Windows | > AGENT_HOME/bin/agent –development debugPort=xxxx * |
| Unix | > AGENT_HOME/bin/agent.sh –development debugPort=xxxx * |
(*) xxxx is the port number where the Kiuwan Rule Developer will wait for a remote debug tool to become attached to. Note that the application will not be launched until the remote debug tool is detected by the process.
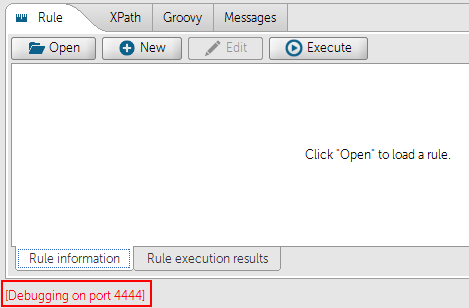
If the attachment is successful, you will see a red label indicating the current debugging port in the bottom left of the Rule Developer window:

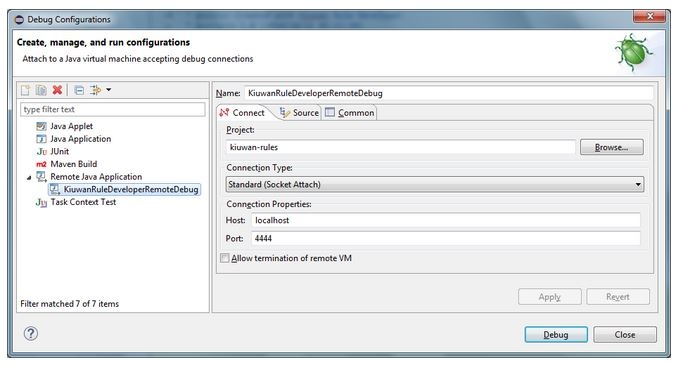
Once the Kiuwan Rule Developer is waiting for the debugger to be attached, create a remote debug configuration in your IDE.
To do this with Eclipse:
- Right-click your Kiuwan custom rules project in the Explorer view.
- Select Debug As and then select Debug Configurations…
- Double click Remote Java Application on the left side of the dialog shown.
- Fill the Connection Properties form with these values:
- Host: localhost
- Port: xxxx (the port number you specified when launching Kiuwan Rule Developer).
- Click Debug.

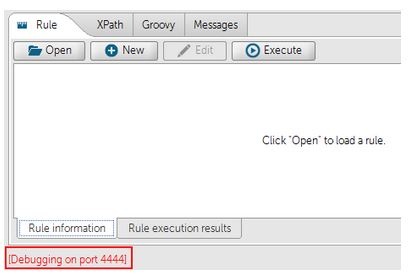
Make sure the specified debug port matches the one configured in your remote debug tool. If the attachment is successful, Kiuwan Rule Developer will start and you will see a red label indicating the current debugging port in the bottom left of the Rule Developer window:

Once Kiuwan Rule Developer is started in debug mode:
- Set a breakpoint in your rule’s source code.
- Execute the rule in Kiuwan Rule Developer.
- Eclipse should stop in the breakpoint.
- You are ready to debug your custom rule!

