Deliveries view
Introduction
Kiuwan provides support for Application Life Cycle, allowing to run analysis based on application's Baselines and Deliveries.
An application Baseline is a specific version of an application that is relevant enough to be considered as a reference to track further changes on it.
This version might be a productive or a development version of the application, depending on its life cycle stage:
- If the application is running in production, you might consider the production version as the baseline, so you can track differences of any further changes.
- If the application is under development, you might consider some important development milestone (e.g. the Minimum Viable Product release in Agile methodology) as your baseline.
Whatever be the reason to consider a concrete version as the baseline, that version will be considered as the reference to track (and compare) any new distribution of the application.
A new distribution of the application contains changes to the baseline due to corrective or evolutive maintenance. The new distribution will contain a set of source files that modify the source code of the application baseline.
In Kiuwan terminology, those changes to the application baseline are considered as a Delivery.
Depending on the content, the delivery can be Partial (only a subset of application files is delivered) or Complete (the complete application source code is delivered).
Kiuwan's functionality on Baseline and Deliveries allows to fully managing the complete applications life cycle:
- To establish a baseline version of the application, with known state in terms of quality indicators, defects and associated action plan
- To keep track of modifications to the application baseline and relate those modifications to your Life Cycle model (Feature Requests, Branches, etc)
- To trace the progress of a new version against a defined action plan
- To compare those new versions of the application against the baseline
- To define "validation" conditions (an Audit in Kiuwan terms) and let Kiuwan to automatically check if those conditions are met by the delivery, providing a full report of validation status, reasons and what to do in case the audit fails.
- To evolve the baseline, either by creating a nee baseline or by promoting deliveries
- In case of a complete delivery, updating the whole baseline with the delivery results
- In case of a partial delivery, updating incrementally the baseline with the delivery results
Definition of the scope of the analysis (Baseline or Delivery)
At time of running a Kiuwan analysis, you can specify the scope of the analysis.
If you are running your analysis in the cloud, that analysis will be always considered as a Baseline analysis. To define other scopes, you should use Kiuwan Local Analyzer (KLA).
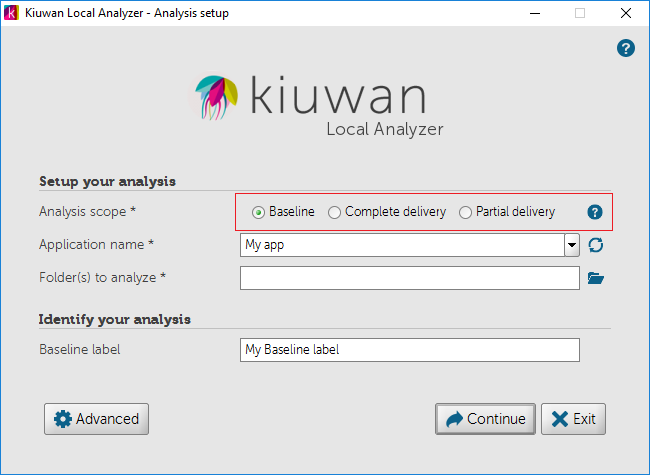
Previously to run a new analysis with KLA, you must select a scope depending on the type of analysis you want to run
- Baseline: development milestones are usually analyzed as baselines
- Complete delivery: an important delivery of the whole application
- Partial delivery: a delivery usually associated to a change request
Icon
KLA in CLI mode also allows to specify scope analysis options.
Please visit Code analysis using the downloaded agent#CommandLineInterface(CLI)script documentation for specific help on how to do it.
<< Deliv-1.png>>
Baseline Analysis
Selecting Baseline option, Kiuwan will run the analysis as a baseline analysis of the selected application. The analysis will be run by default with the Model associated to the application, or you can specify a different model clicking on "Advanced" button.
After running the Baseline analysis, "View Page" button will take you to Summary panel of the selected application Dashboard.
Delivery Analysis
In case of a Delivery analysis, Kiuwan allows to specify further details.
<< Deliv-2.png>>
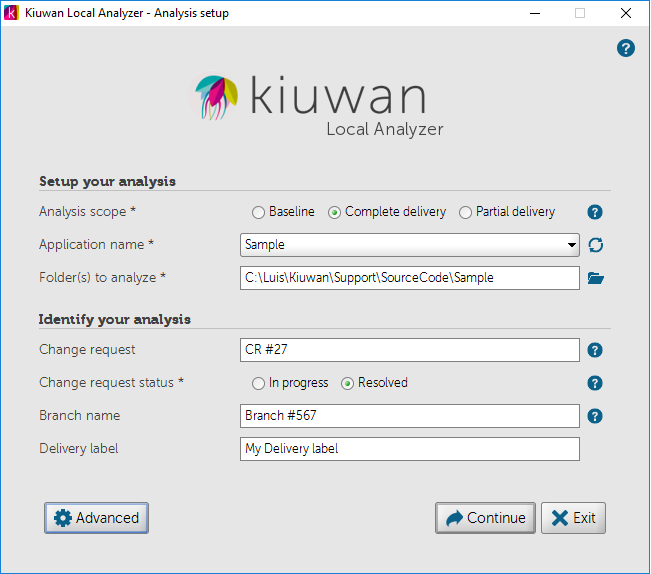
The Delivery can be specified as Complete or Partial. This depends on whether you're analyzing the complete application (Complete delivery) or a portion of it (Partial delivery).
Icon
Before to run a Delivery analysis, please be sure that a Baseline analysis exists. Otherwise, you will not be able to run a Delivery analysis.
Also, note that in Delivery mode it's not allowed to change the model. Application's model will be used for the analysis.
You can specify Change Request (CR) name (or id). This will allow you to link this analysis to a specific change request as considered in your ALM process.
Also, you can specify the Change Request Status to link analysis to different phases of your development process. When analyzing a delivery, you can indicate CR status:
- In progress: Use this option when CR is under development but you want to inspect Kiuwan results, know the Audit status but not include delivery results in overall statistics (please note that only "Resolved" deliveries will be included in Governance statistics). Typical uses might be analyses launched every day in Continuous Integration or for discrete analyses after concrete code changes.
- Resolved: This is the default value, use this option when the delivery to analyze is stable enough to be promoted to a testing/production environment.
Icon
Important: Only Deliveries with Resolved CR Status will be considered in Governance statistics.
If the delivery were associated to a branch in your SCM system, you can specify it in Branch Name field.
Finally, you can associate a label to this Delivery analysis in Delivery Label field.
Any Delivery analysis will automatically run the Audit associated to the selected application. After running the analysis, the View Results button will take you to the Audit page results, where you will see the results of the Audit and related information. Please, visit Audits Management for specific help on Audits.
Icon
KLA in CLI mode also allows to specify delivery analysis options.
Please visit Code analysis using the downloaded agent#CommandLineInterface(CLI)script documentation for specific help on how to do it.
Deliveries and Continuous Integration
Kiuwan allows to fully integrate analysis in a Continuous Integration system.
If you are using Jenkins, Kiuwan Plugin for Jenkins allows to specify analysis scope and options when integrating Kiuwan in Jenkins jobs.
Please, visit Jenkins plugin for further info on Kiuwan Plugin for Jenkins and how to launch baseline/deliveries analysis.
For other CI systems, you can use Kiuwan Local Analyzer (KLA) in Command Line Interface (CLI). KLA in CLI mode allows to fully specify at runtime the above options and therefore be integrated in any script embedded into your CI system.
Please, visit Code analysis using the downloaded agent#CommandLineInterface(CLI)script for further info on running KLA in CLI mode.
Deliveries Management
Deliveries Module can be accesed by selecting "Deliveries" tab.
<< Deliv-3.png>>
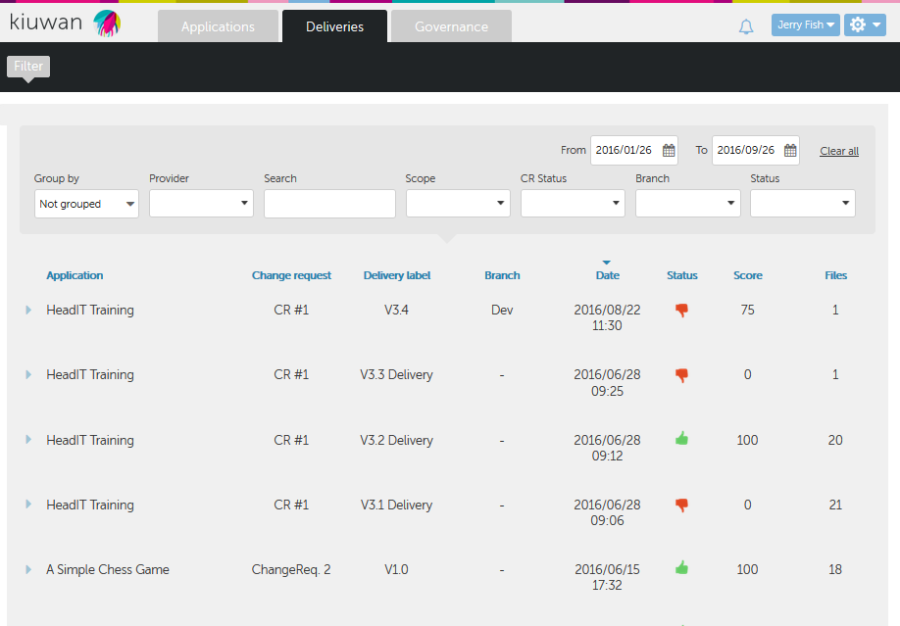
Deliveries module displays information on existing deliveries, allowing to take some actions on them.
Basically, this module allows to search for deliveries specifying different searching criteria:
- Date range: Search deliveries launched within a date range (using From and To date fields)
- Provider: Search deliveries that belongs to the selected providers.
- Scope: Search by "Complete" or "Partial" deliveries
- CR Status: Search by "In progress" or "Resolved" deliveries
- Branch: In case you specify branch name, this selector will present you available brach names to search for
- Status: This selector allows to search deliveries based on Audit status ( OK or Failure)
Group By field allows to display deliveries in three modes.
<< Deliv-4.png>>

Not Grouped
If Not gouped, Kiuwan will display deliveries ordered by analysis date.
For every delivery, Kiuwan will display information as show in the picture.
<< Deliv-5.png>>
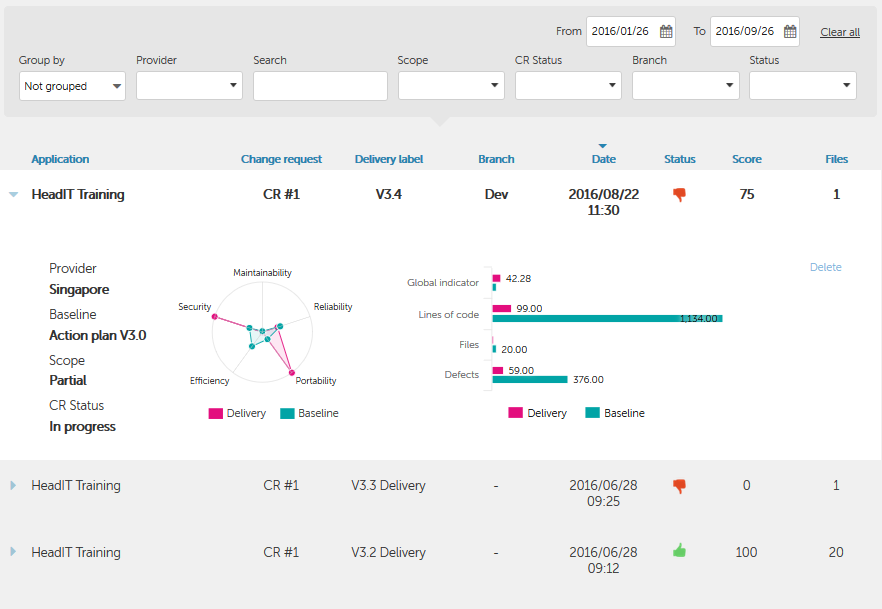
Next information is presented for every delivery:
- Associated Change Request, Delivery Label, Branch and analysis Date
- Status: result of Audit (Ok or Fail, thumb up / down icon)
- Score: overall delivery compliance with the defined audit (please visit Audits Management#AuditApprovalThreshold for futher info on audit score)
- Files: number of files of the delivery
Additional details can be displayed clicking on the triangle icon at the left of each delivery.
<< Deliv-6.png>>

Detailed information provides usefull information to compare analysis results of delivery versus baseline. It provides a comparative between the delivery and the baseline
- Quality Indicator of delivery versus baseline for every characteristic
- Global Quality indicator, lines of code, number of files and number fo defects
Delete link allows to remove the delivery analysis from Kiuwan.
Group by Application
If Group by Application, Kiuwan will display deliveries grouped by the application they belong.
For every application, Kiuwan will display information as show in the picture.
<< Deliv-7.png>>
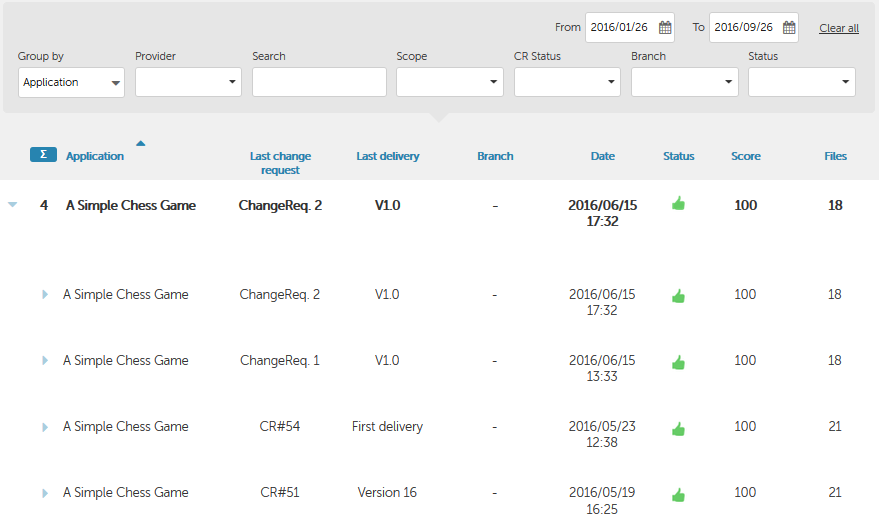
Application records display information on last delivery for that application. First field (summatory symbol) shows the total number of deliveries of that application.
Clicking on the triangle icon at the left of each Application opens a complete list of the deliveries of the application.
Details of every delivery are displayed when clicking on the triangle icon at the left of each delivery.
Group by Change Request
If Group by Change Request, Kiuwan will display deliveries grouped by the Change Request they belong.
This option would be usefull, for example, when you need to know how many deliveries are associated to a CR (providing an indicator of the quality of the delivery process).
For every CR, Kiuwan will display information as show in the picture.
<< Deliv-8.png>>
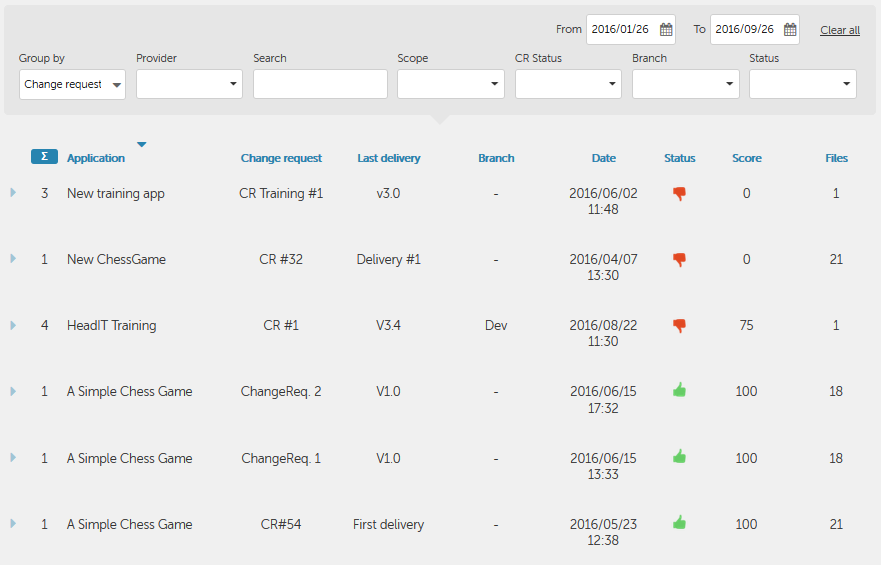
CR records display information on last delivery for that CR. First field (summatory symbol) shows the total number of deliveries of that CR.
Clicking on the triangle icon at the left of each CR opens a complete list of the deliveries of the CR.
Details of every delivery are displayed when clicking on the triangle icon at the left of each delivery.
Deliveries details
For every delivery, you can access the Delivery Details module clicking either on the Status icon or in the Files link. In both cases, Delivery Details module will open.
<< Deliv-10.png>>

Deliveries Audit
Clicking on the Status icon (thumbs up or down) of a delivery will open the Audit Results for that delivery.
<< Deliv-9.png>>
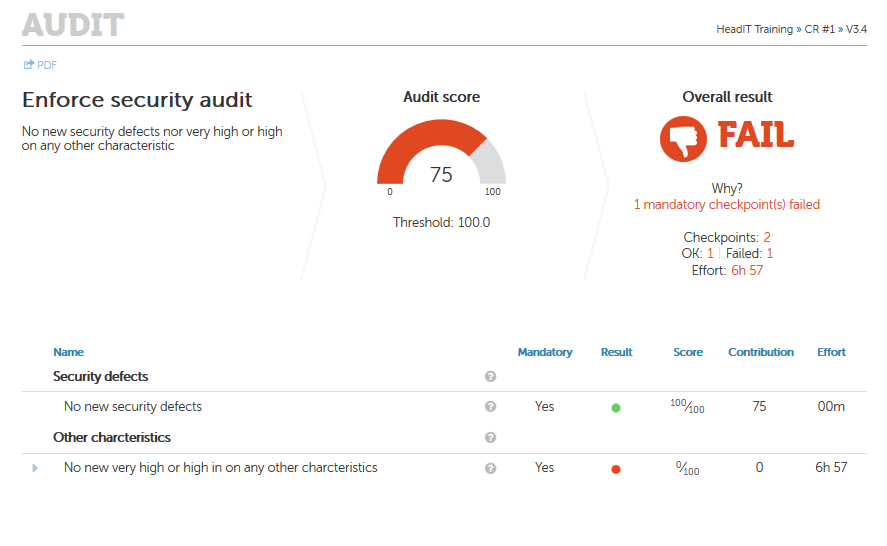
Please visit Audits Management#AuditResultsPage for details on Audit Results.
Deliveries Files
Clicking on the Files link of a delivery will open the Files details for that delivery.
<< Deliv-11.png>>
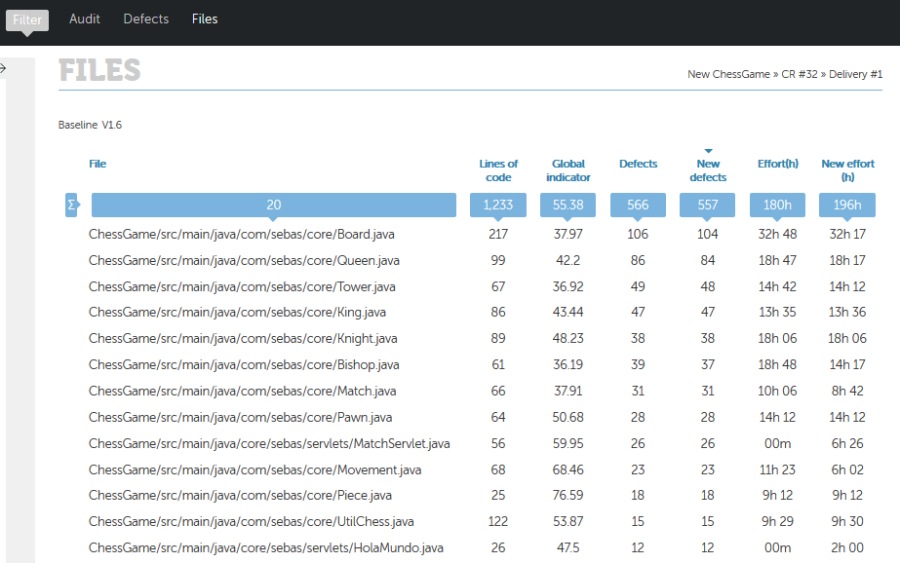
It displays a complete list of files included in the delivery.
For every file, it shows absolute metrics of that file (lines of code, global indicator, number of defects and associated effort to target).
Also, it shows metrics relative to the same file when it was analyzed as part of the application baseline:
- New defects: number of new defects of this file as compared to defects when analyzed as part of the baseline
- New effort: effort associated to these new defects
Deliveries Defects
Clicking on the Defects tab will open the Defects details for the selected delivery.
<< Deliv-12.png>>
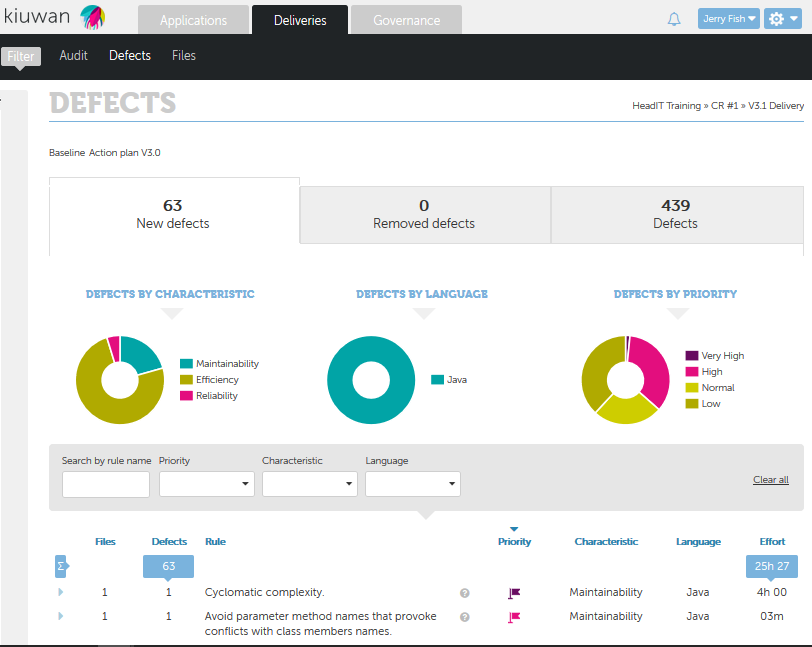
Defects page shows detailed information on delivery's defects.
Informations is organized in three sections (New defects, Removed defects and Defects), visually displayed as tabs.
New defects section shows the total number of new defects that the delivery has introduced in the application (as compared to baseline).
These new defects may come from two sources:
- defects found in the delivery files that did not appear when were analyzed in the baseline, and
- defects found in new files, i.e. files that were not part of the baseline
Removed defects section shows the total number of defects that this delivery has removed from the baseline.
The scope of the delivery affects how removed defects are calculated:
- In case of a Partial delivery, removed defects calculus is based on the comparison between the defects found in the delivery files and defects of the same files when analyzed in the baseline.
- In case of a Complete delivery, removed defects will also include those defects of files that were analyzed in the baseline but are not part of the delivery. As the delivery is complete, analysis assumes that those files are not part of the application any more so their associated defects have been implicitly removed.
Defects section shows the total number of defects found in the delivery files.
Clicking on any of those defects tabs will allow to see complete detail on defects.
Deliveries Promotion to Baseline
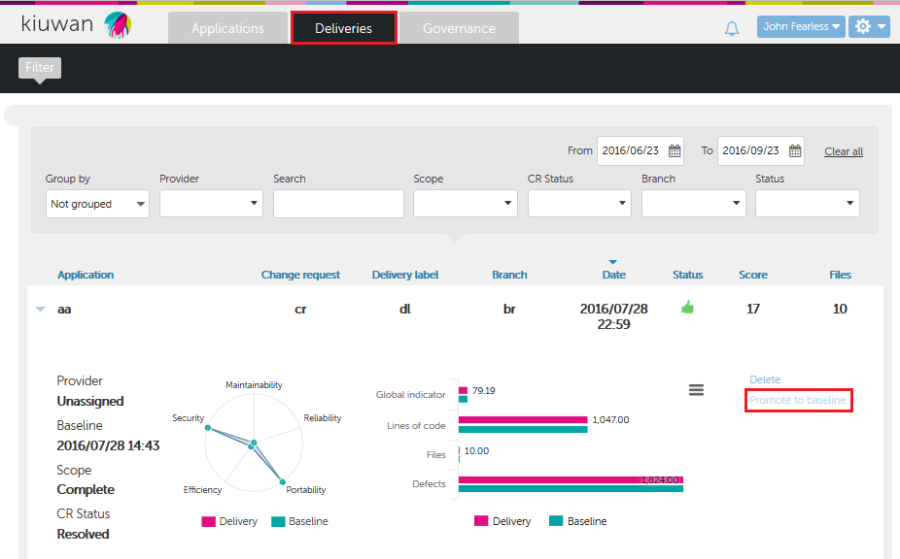
Deliveries can be "promoted" to baseline without the need to run a new analysis.
To promote a delivery to a baseline means that a new baseline will be calculated based on delivery analysis results.
This new baseline will be calculated differently depending on the delivery scope.
If the delivery is Complete, new baseline indicators will be calculated based completely on delivery defects, i.e. not taking into account any previous baseline analysis.
If the delivery is Partial, new baseline indicators will be incrementally calculated as follows:
- For any new file contained in the delivery (i.e. not existing in the baseline), the file and associated defects will be included as part of the new baseline.
- For every file contained in the delivery and in the baseline, defects found during the delivery analysys will overwritte defects found when analyzed in the baseline
- For those files contained in the baseline but not included in the delivery, previous defects will be maintained
Icon
Deliveries promotion to Baseline can be done either using Kiuwan Deliveries page or using Kiuwan Local Analyzer in Command-Line Interface mode.
This section describes how to do it using Kiuwan Deliveries page.
For help on how to do it using Kiuwan Local Analyzer, please visit Code analysis using the downloaded agent#DeliveriesPromotiontoBaseLine documentation page.
<< Deliv-13.png>>
Icon
The promotion is not restricted to successfully deliveries. If you want to promote a failed delivery you are allowed to do it.
Once you click in 'Promote to baseline' link, you are asked for a new label for the baseline. By default, the delivery label is proposed.
<< Deliv-14.png>>

The promotion analysis is added to an execution queue. Once is finished, the results are showed in the application Dashboard as a new baseline analysis.
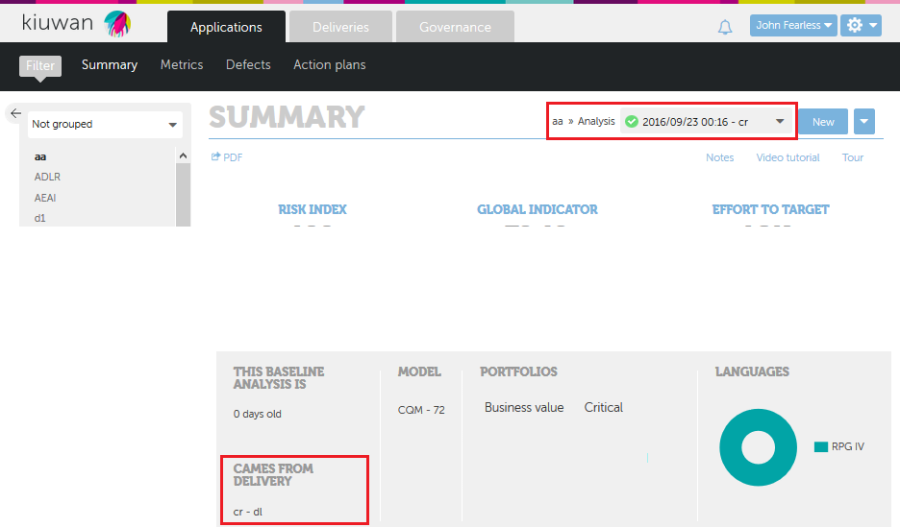
This analysis will contain a legend that indicates that the baseline comes from a delivery analysis.
<< Deliv-15.png>>
