This documentation is aligned with Kiuwan Jenkins Plugin latest version.
See the official Kiuwan Jenkins Plugin wiki to check the latest version and the minimum Jenkins version required to run the plugin.
The Kiuwan Plugin for Jenkins allows you to execute Kiuwan analysis as a Post-build action or as a Pipeline step. If you need to execute a Kiuwan step within a Jenkins Pipeline, please scroll to the “Using pipelines” section.
Installing the plugin
The Kiuwan Plugin for Jenkins can be downloaded and installed like any other Jenkins plugin, check the options below:
- Go to your Jenkins installation Plugins Manager’s Available tab ([YOUR_JENKINS_URL]/pluginManager/available) and look for “Kiuwan plugin” in the search box.
- Or, follow these steps:
- Enter your Jenkins dashboard
- Select Manage Jenkins and click Manage Plugins.
- From the top tabs, select Available.
- Find the Kiuwan Plugin using the search function of your browser or the search box provided by Jenkins.
- Check and install.
If your Jenkins version is not compatible with the plugin, Jenkins shows a message. You can check the minimum Jenkins version needed to run the plugin on the plugin’s page.
Some functionalities (like pipeline integration) are not available for older Jenkins versions. Check Getting started with Pipeline for details on Jenkins minimum requirements to work with pipelines.
Upgrading from older versions
Upgrading the plugin is straightforward. You can follow the standard procedure for upgrading a plugin by accessing Jenkins Plugins Manager’s Updates tab ([YOUR_JENKINS_URL]/pluginManager).
Upgrading to version 1.6.0 or later from version 1.5.2 or previous launches a migration process to add new functionality to existing configuration or jobs using Kiuwan post-build action. A new connection profile named “Kiuwan Connection Profile 1” is automatically created and assigned to all existing jobs that use the Kiuwan post-build action.
Configuring connections
To configure Kiuwan Plugin for Jenkins, navigate to the Configure System page in your Jenkins installation ([YOUR_JENKINS_URL]/configure) and look for the Kiuwan Global Settings section.
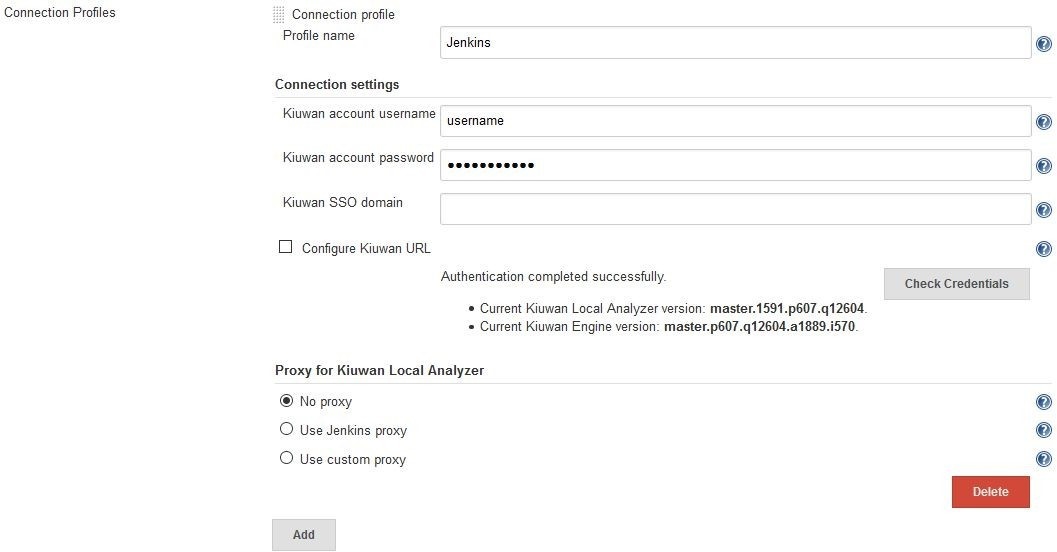
The plugin lets you define different “Connection Profiles” in case you want to connect to different Kiuwan instances or use different users for specific jobs. These are the available options:
- Profile name: A name to identify this connection profile. If you are configuring multiple connection profiles, use a descriptive name to easily distinguish them and to avoid duplicating profile names.
- Connection settings:
- Kiuwan account username: Username of your Kiuwan account.
- Kiuwan account password: Password of your Kiuwan account.
- Kiuwan SSO domain: SSO domain identifier of your Kiuwan account. If you have not enabled SSO in your account, leave this field blank.
- Configure Kiuwan URL / Kiuwan server URL: When under a Kiuwan On-Premises environment, check this box, and set the Kiuwan URL for your Kiuwan On-Premise installation e.g. https://kiuwan.onpremise.local/saas.
To access a Kiuwan On-Premises installation through HTTPS protocol, the CA that signed the certificate offered by your Kiuwan On-Premises installation must be trusted by the JDK that runs Jenkins.
For more information about certificates and Kiuwan On-Premises refer to: Managing Certificates.
- Proxy for Kiuwan Local Analyzer: The selected option only applies to Kiuwan Local Analyzer. Connections made by the plugin itself always use the configured Jenkins proxy (see [YOUR_JENKINS_URL]/pluginManager/advanced.
- No proxy: Select this option if you do not want the Kiuwan Local Analyzer process to use a proxy server when connecting to Kiuwan.
- Use Jenkins proxy: Select this option if you want the Kiuwan Local Analyzer process to use the Jenkins proxy settings when connecting to Kiuwan.
- Use custom proxy: Select this option if you want the Kiuwan Local Analyzer process to use a custom proxy when connecting to Kiuwan. You can set here all the options supported by the Kiuwan Local Analyzer.
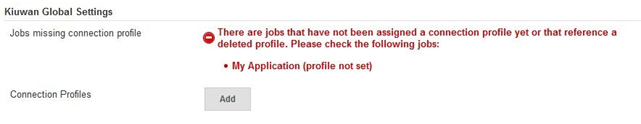
Once a connection profile is created, you are ready to add Kiuwan to your jobs.
Make sure that you do not delete a connection profile that is referenced by any of your jobs. This would make the job fail when starting the Kiuwan step. The plugin shows a message listing jobs that are referencing an inexistent connection profile:
Checking credentials
Click Check Credentials to make sure the plugin can connect to Kiuwan with the specified credentials. If the test succeeds, the current Kiuwan Local Analyzer and Kiuwan Engine versions are shown. However, this test only checks the connection between your Jenkins master node and Kiuwan. To check the connection between Kiuwan Local Analyzer and Kiuwan it is necessary to run a job and wait for the analysis process to connect to Kiuwan (this is one of the first steps in any analysis), as slaves may access Kiuwan from a different network area.
If your Jenkins slaves access Kiuwan from the same network as the Jenkins master, make sure to select the Use Jenkins proxy option in the Proxy for Kiuwan Local Analyzer section of the connection profile options. In case you are accessing the internet through a proxy server, see the next section for more information.
Proxy usage
When the plugin tries to connect with Kiuwan it always uses the configured Jenkins proxy, but as it acts as a bridge between Jenkins and the Kiuwan Local Analyzer when executing analyses, you should choose a specific proxy configuration for the latter. This is done in the Proxy for Kiuwan Local Analyzer section of a connection profile.
These options grant that any connection made from the Jenkins master (done by the plugin) are independent of the connections made by Kiuwan Local Analyzer to Kiuwan servers. This is very useful under scenarios where Jenkins slaves are located in different network areas.
To use a proxy with basic authentication under Jenkins, remember that the default network properties in Java must be modified. The property “jdk.http.auth.tunneling.disabledSchemes” should not contain a “Basic” value. This property can be found under the JRE/JDK installation folder, in the jre/lib/net.properties file.
It can also apply to the JRE/JDK that runs the KLA. If it is not the same as the one that is using Jenkins and an authenticating proxy is configured to be used in KLA, the property should be configured as well.
Running Analyses
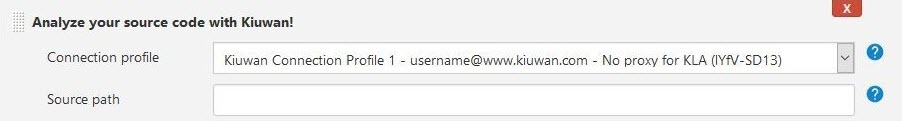
The Kiuwan analysis is executed as a post-build action. To run Kiuwan, add the post-build action named Analyze your source code with Kiuwan! in your job configuration.
First, you should:
- Choose a connection profile to use when analyzing. In case you see a message stating that there are no connection profiles created, please refer to the Configuring connections section.
- Choose a source folder to analyze. In case you want to analyze the current workspace, just leave blank the “Source path” text box. If a relative path is specified, it will be resolved against the current workspace.
- Baseline Mode
- Delivery Mode
- Expert Mode

You can configure any parameter by referencing system variables with the following syntax: ${MY_VAR}
Baseline Mode
You can execute a baseline analysis, check its results, and change the status of your build if the selected measure does not meet the selected thresholds. Selecting the baseline mode configures the Kiuwan Plugin for Jenkins to define the analysis scope as the baseline.
The main configuration parameters are:
- Kiuwan Application Name: Set to the application name defined in Kiuwan.
- If the app does not exist, it will be created.
- If not set, the Jenkins project name will be used.
- Analysis Label: Set a label to identify the analysis.
- If not set, Jenkins build number (#n) will be used.
Click Advanced to define additional configuration parameters:
- Encoding: The encoding of the source files that will be analyzed.
- Include and Exclude patterns for the analysis: See Source Code Filters.
- Timeout: Indicates the maximum allowed time (in minutes) for Jenkins to wait for Kiuwan analysis. If that time is reached, the build will be set to ABORTED.
- Indicate languages / Languages: Check this box if you want to indicate explicitly the list of languages to analyze. Leaving this box unchecked, the analysis engine will try to discover all available languages present in the current source path.
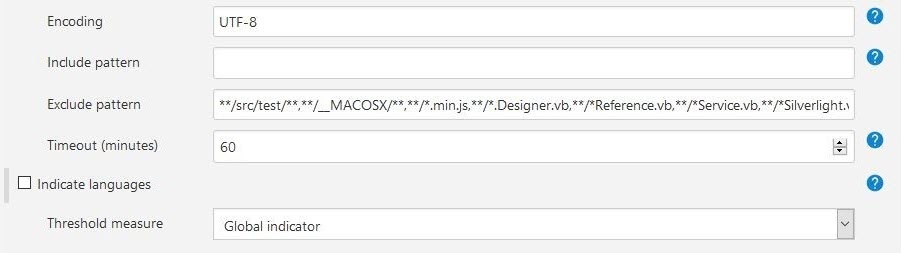
In some operation modes the plugin waits for the analysis to be processed in Kiuwan. The timeout set in this field includes this waiting time as well.
To customize any other configuration parameter when using this mode, the recommended approach is to use a centralized configuration. Check Centralized Analysis Configuration for more information.
You should also consider using the expert mode and passing configuration parameters from the command line.
When using the baseline mode, you can set the build status depending on thresholds based on indicators of the Kiuwan analysis:
- Global Indicator.
- Risk Index.
- Effort to Target.
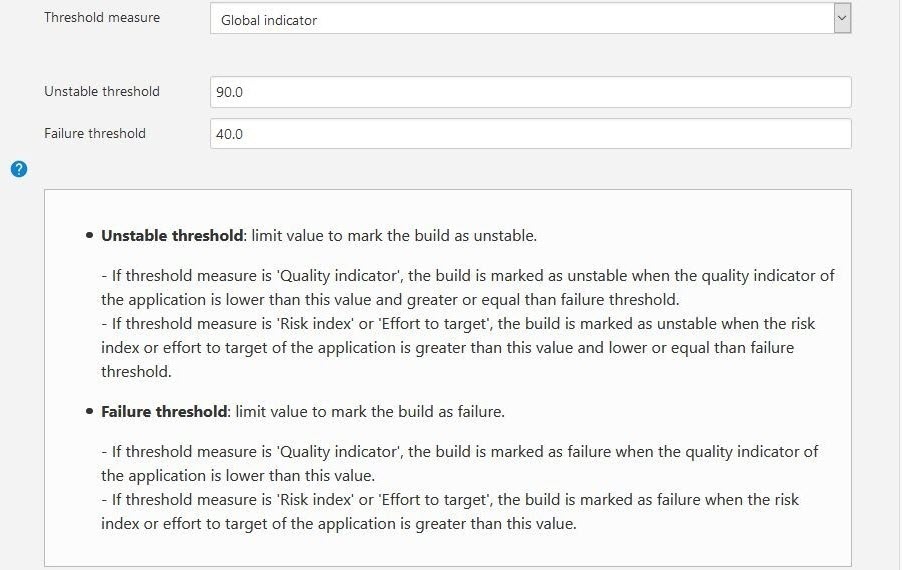
You can define thresholds to mark the build as UNSTABLE and FAILURE depending on indicator values as the above picture shows.
Checking the configured threshold for the previous indicators will force the plugin to wait synchronously for the analysis results to be processed in Kiuwan. If you are not interested in evaluating any indicator, set this option to “None - wait for results disabled”.
Delivery Mode
You can execute a delivery analysis if your account subscription includes Life Cycle.
Selecting the delivery mode configures the Kiuwan Plugin for Jenkins to define the analysis scope as delivery (partial or complete).
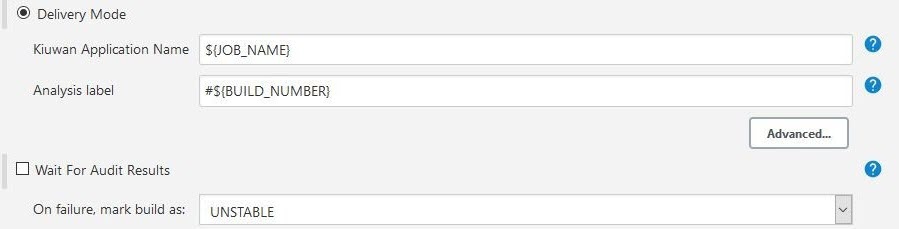
As in baseline mode, you need to define the Kiuwan Application Name and an optional Analysis label.
The Wait For Audit Results checkbox allows you to change the Jenkins execution result depending on the result of the audit associated with the Kiuwan application. If checked, the build will be marked by default as UNSTABLE in case the audit fails.
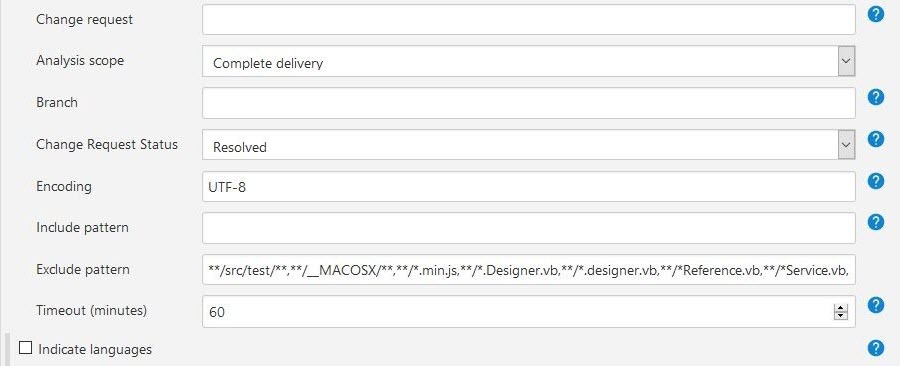
Also, clicking Advanced… allows you to set additional parameters:
- Change request: A text (usually a code in a ticketing system) that helps you identify and associate this analysis with a change request.
- Analysis Scope: Defines the type of delivery:
- Complete delivery: Important delivery of the whole application.
- Partial delivery: A delivery usually associated with a change request.
- Branch: Name of the branch you are working in. Kiuwan will use this field to label the current delivery.
- Change request status: Kiuwan can give you feedback at different phases of your development process.
- In progress: When working in an isolated environment or when you need Kiuwan's feedback for a concrete code change.
- Resolved: this is the default value, use this option when the delivery to analyze is stable enough to be committed to a common environment.
- Encoding, Include/Exclude pattern, Timeout, Indicate languages: See the baseline mode section for more information about these parameters.
Expert Mode
Selecting expert mode allows full control of the Kiuwan analysis configuration.
You can set the Kiuwan Local Analyzer's command-line options and extra parameters manually.
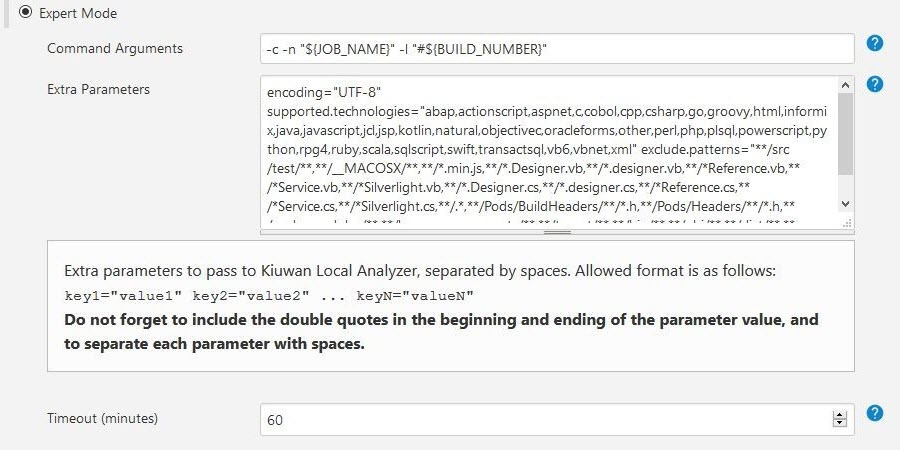
Expert Mode allows you to set/override any parameter value that can be passed to Kiuwan Local Analyzer. Check for more information: Kiuwan Local Analyzer CLI - Command Line Interface.
When clicking Advanced… you can bind the result codes of Kiuwan Local Analyzer with Jenkins' build results.
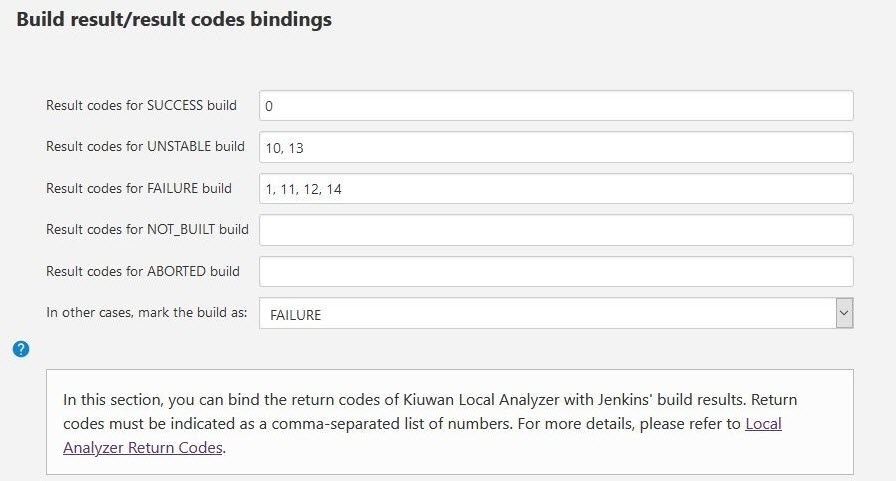
You can find a further reference on return codes in Local Analyzer Return Codes.
Using pipelines
Kiuwan plugin for Jenkins can also be used as part of a Jenkins Pipeline since version 1.6.0. All you need to do is reference the kiuwan step in your pipeline.
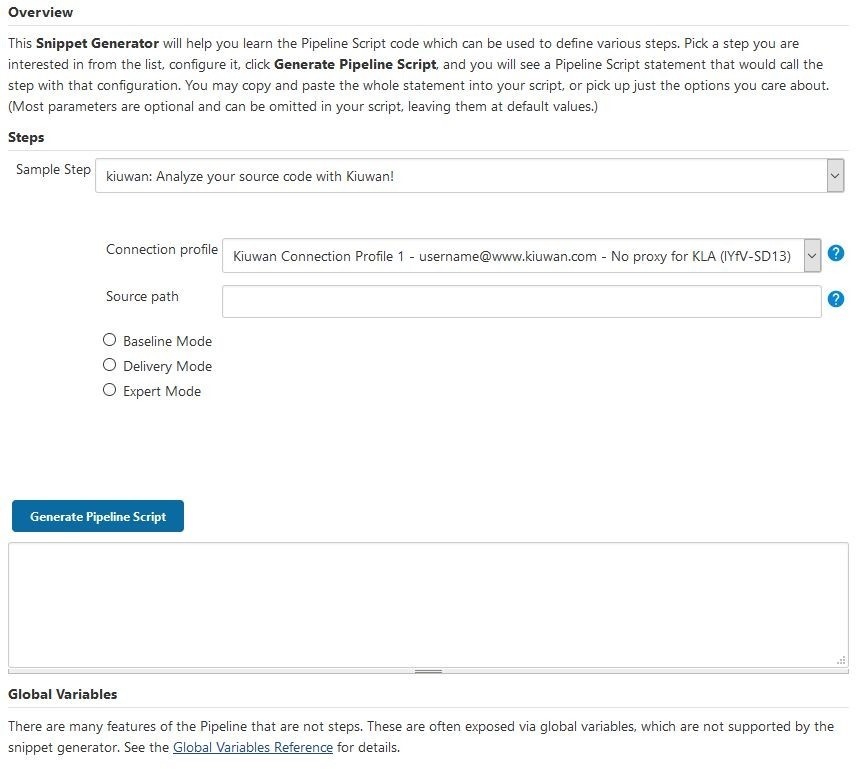
To assist in the creation of the pipeline step, you can use the Snippet Generator and generate the required code. The Snippet Generator can be found at [YOUR_JENKINS_URL]/pipeline-syntax/.
In the Sample step drop-down menu, look for the option named kiuwan: Analyze your source code with Kiuwan!. The same form used in a post-build action of a job will be shown. Simply configure your step and click the Generate Pipeline Script.
The following example shows how to run an analysis in baseline mode with some custom configuration options set. This is what you should configure in the snippet generator form:
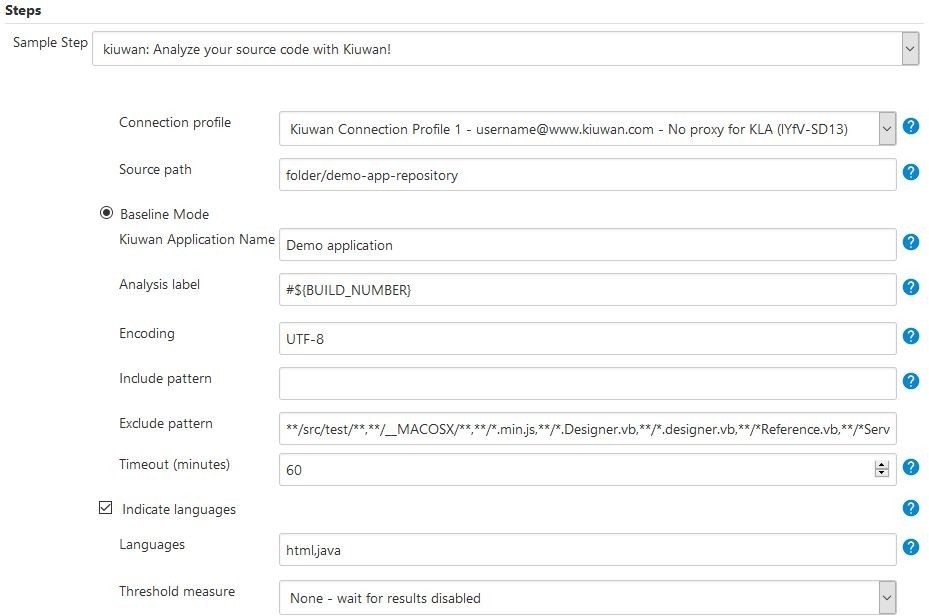
And the generated script, as follows:
kiuwan connectionProfileUuid: 'lYfV-SD13',
	   sourcePath: 'folder/demo-app-repository',
	   applicationName: 'Demo application',
	   indicateLanguages: true,
	   languages:'java,python',
	   measure: 'NONE'
Inspecting the analysis output for further processing
By default, Kiuwan Local Analyzer stores a .json file containing the analysis results in the following path: [WORKSPACE]/kiuwan/output.json
You can read this file from your pipeline code if you want to process the output of the analysis. In this example we are using the readJSON function from the “Pipeline Utility Steps” plugin to access the Kiuwan’s Code Security security rating of an analysis:
def kiuwanOutput = readJSON file: "${env.WORKSPACE}/kiuwan/output.json"
def secRating = kiuwanOutput.Security.Rating
For a complete reference of the analysis results json object please refer to the output format of Kiuwan REST API’s method “Get application analysis”. For more information, check the REST API documentation.
If you want to customize where the output file will be stored, you can pass to the kiuwan pipeline step the parameter outputFilename (note that this parameter is not configurable from the snippet generator). Relative paths will be resolved against the current workspace.
Using pipelines for plugin versions older than 1.6.0
In case you are running an older version, please upgrade your installation. If you are running Kiuwan Local Analyzer directly from a Jenkins pipeline without using the Kiuwan plugin for Jenkins, note that since version 1.6.0 it will be much easier to execute analyses from a pipeline script and it is now the recommended way to launch a Kiuwan analysis.
Notes when using ephemeral slave nodes
This section is worth reading if you are using ephemeral slave nodes to run your Kiuwan analyses (that is, a slave that is created exclusively to run a job and then it is destroyed, usually implemented through Docker, Kubernetes or Mesos).
In case you are using the standard approach of having pre-allocated slaves or at-the-ready virtual machines, you can skip this section.
Kiuwan plugin for Jenkins uses Kiuwan Local Analyzer under the hood. This means that for each defined connection profile an instance of Kiuwan Local Analyzer (and the corresponding Kiuwan Engine) is downloaded and installed in the node where the analysis is going to be performed. In case the node is an ephemeral node, the installation procedure will be done each time the node is created.
Since version 1.6.0 support for this kind of scenario has been improved and an up-to-date cache of Kiuwan Local Analyzer and Kiuwan Engine distributions will be maintained in the Jenkins master to improve the performance of the installation procedure. This means that whenever a new slave is allocated, the current Kiuwan Local Analyzer and Kiuwan Engine versions will be automatically installed in the slave machine, avoiding any necessary updates needed when running the analysis. The cache will be checked each time a new analysis is to be run, updating the necessary files before installing both Kiuwan Local Analyzer and Kiuwan Engine in the slave node.
Since version 1.6.0 of the plugin, the Jenkins master cache is located here: [JENKINS_HOME]/cache/kiuwan_[CONNECTION_PROFILE_UUID].
Since version 1.6.0 of the plugin, the Kiuwan Local Analyzer installation directory in a slave node (or master node if you are running analyses directly from the master) is located here: [JENKINS_HOME]/tools/kiuwan_[CONNECTION_PROFILE_UUID]/KiuwanLocalAnalyzer.
Viewing analysis results
Once you have installed and configured the Kiuwan plugin in your Jenkins, you can run a Kiuwan analysis after the build process.
After execution, and based on the analysis results, you can mark the build (SUCCESS, UNSTABLE, FAILURE, NOT_BUILT) according to the Kiuwan analysis results.
After the build process, the Kiuwan Plugin for Jenkins adds a link to the analysis results (visible in your Kiuwan account) on the job execution page.
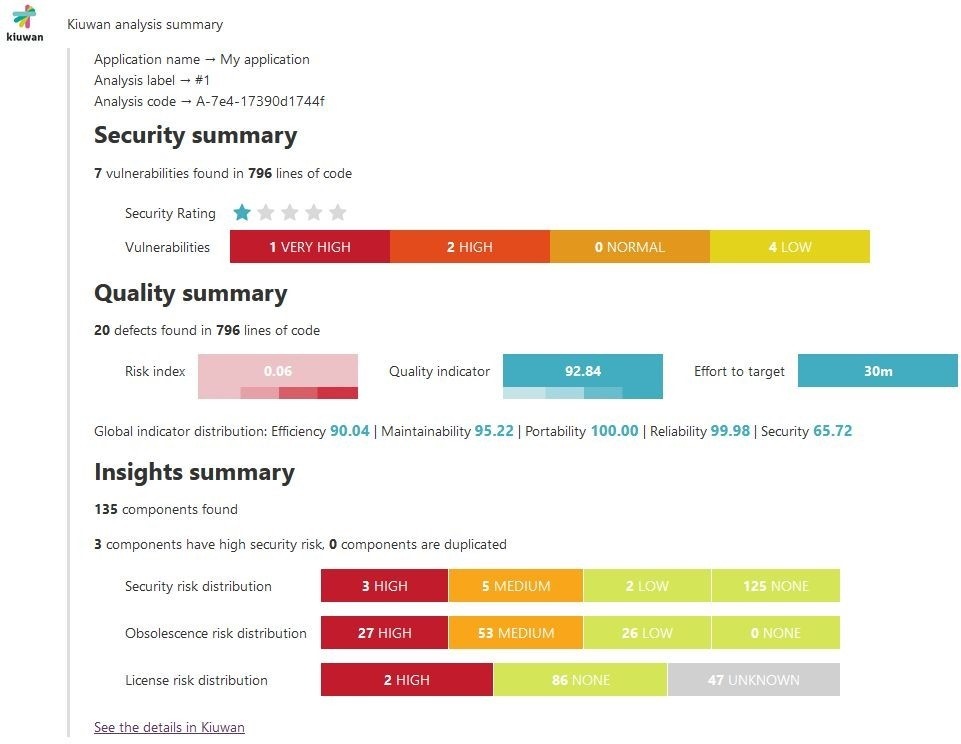
Since version 1.6.0 of the plugin, a summary of the analysis results will be shown. Depending on the analysis scope and on the licensed products, the summary may be different.
An analysis results summary for a baseline analysis for an account subscription that includes CODE SECURITY, CODE ANALYSIS, and INSIGHTS is shown here:
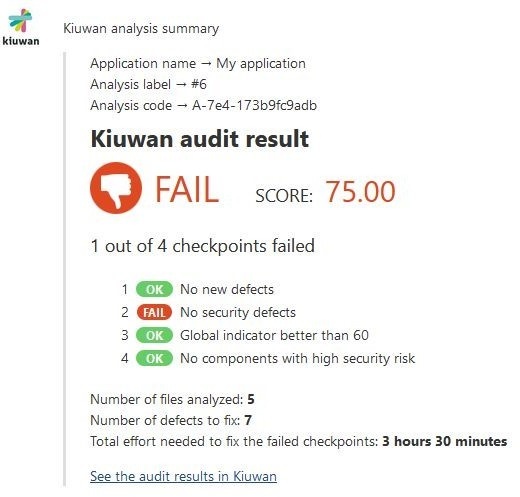
An analysis results summary for a delivery analysis that is configured to pass an audit that includes multiple checkpoints is shown here:
Downloading the plugin source code
You can download the source code of Kiuwan Jenkins plugin from Github. It is open-source and licensed under MIT license.