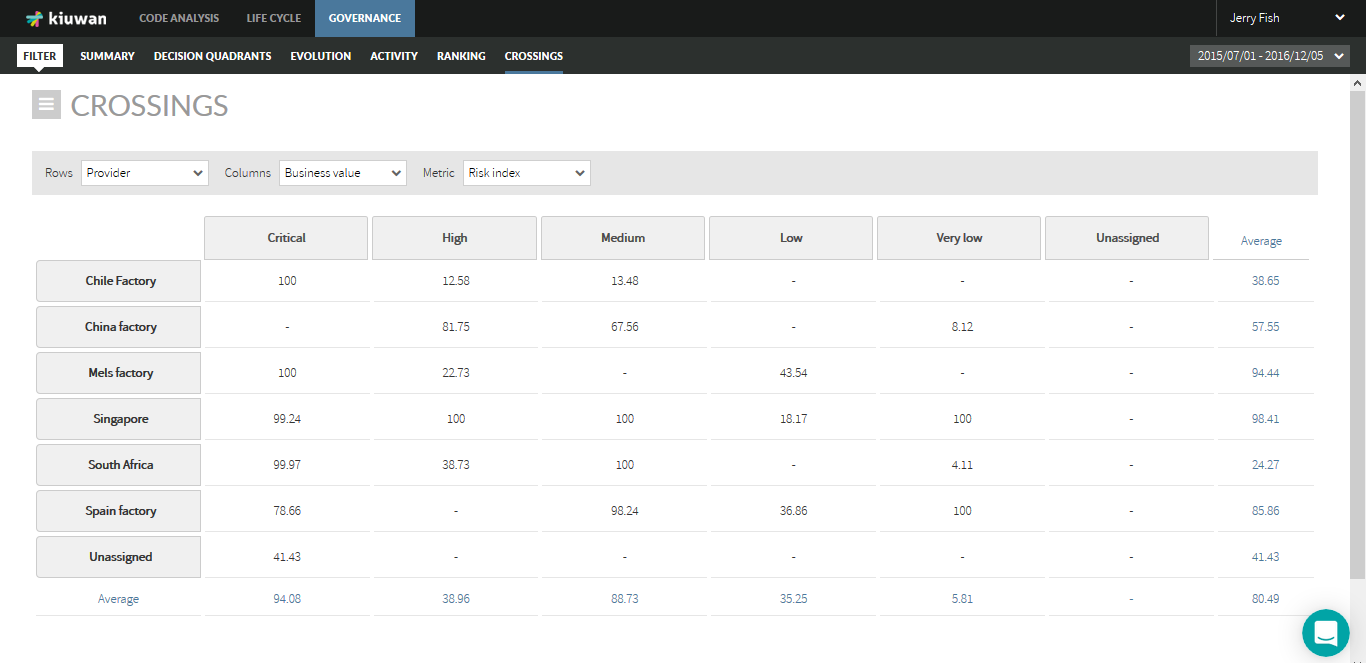
On this screen you can see a table where you can pick the metric whose values you want to see, crossing the data of two different portfolios you want to compare.
This can help to make decisions depending on the crossing selected. For example, you can see the lines of code (metric) developed by your different providers (portfolio 1) according to the business value of the applications (portfolio 2):