Ranking
Ranking page allows to rank applications (or applications grouped by portfolios) on a selected metric or indicator.
Ranking can be based on the following metrics/indicators:
- Business Value
- Lines of Code
- Risk Index
- Global Indicator
- Effort to Target
Application Ranking
If no portfolio is selected in Group by combo, Ranking page will show applications orddered by selected criteria.
It will shows a top-10 graphic as well as a full list of applications.
As an example, next image shows applications sorted by higher "Effort to target".
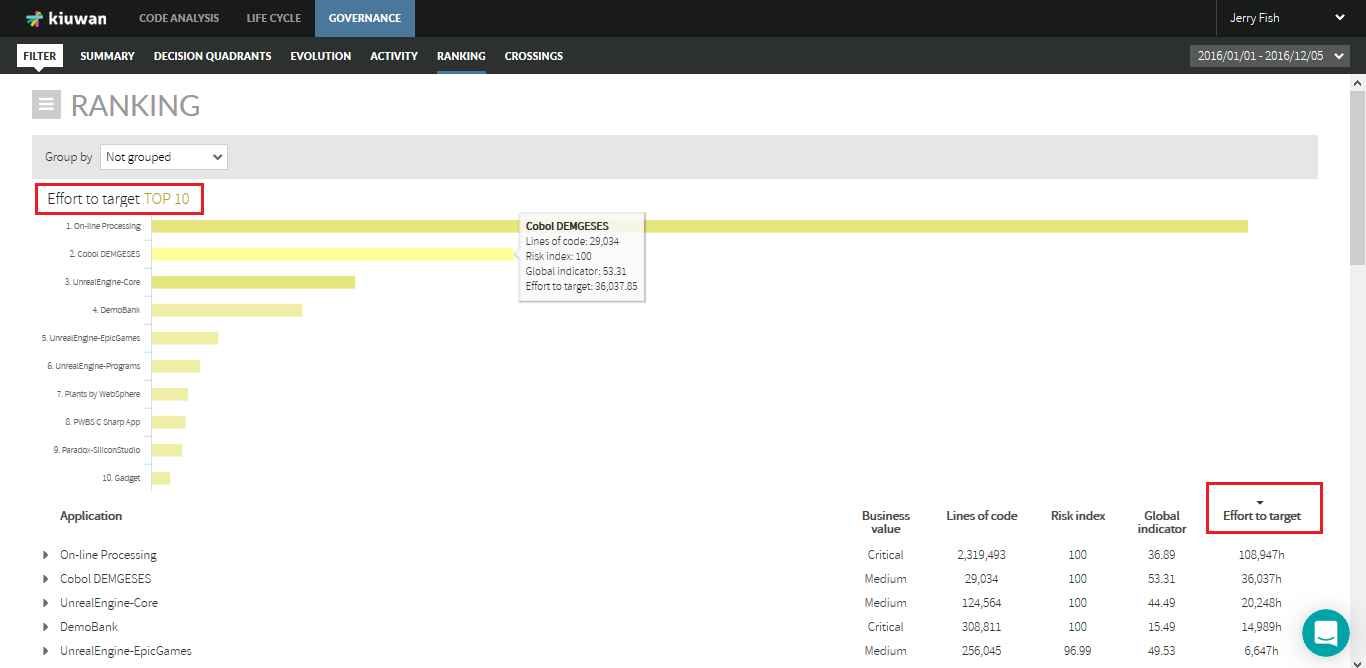
Ranking criteria can be selected clicking on column names.
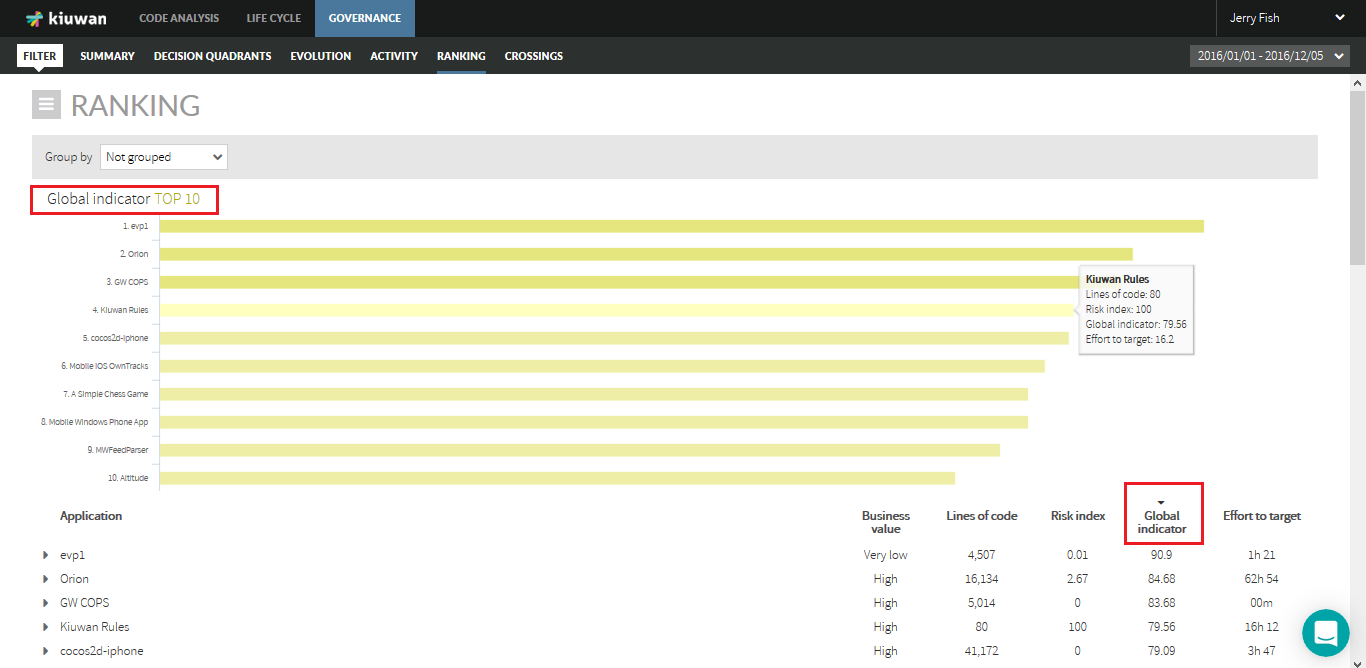
Ranking can be sorted in ascending or descending order. Clink on the selected column to switch between ascending/descending.
Clicking on the right arrow of the application will show complete information on that application.
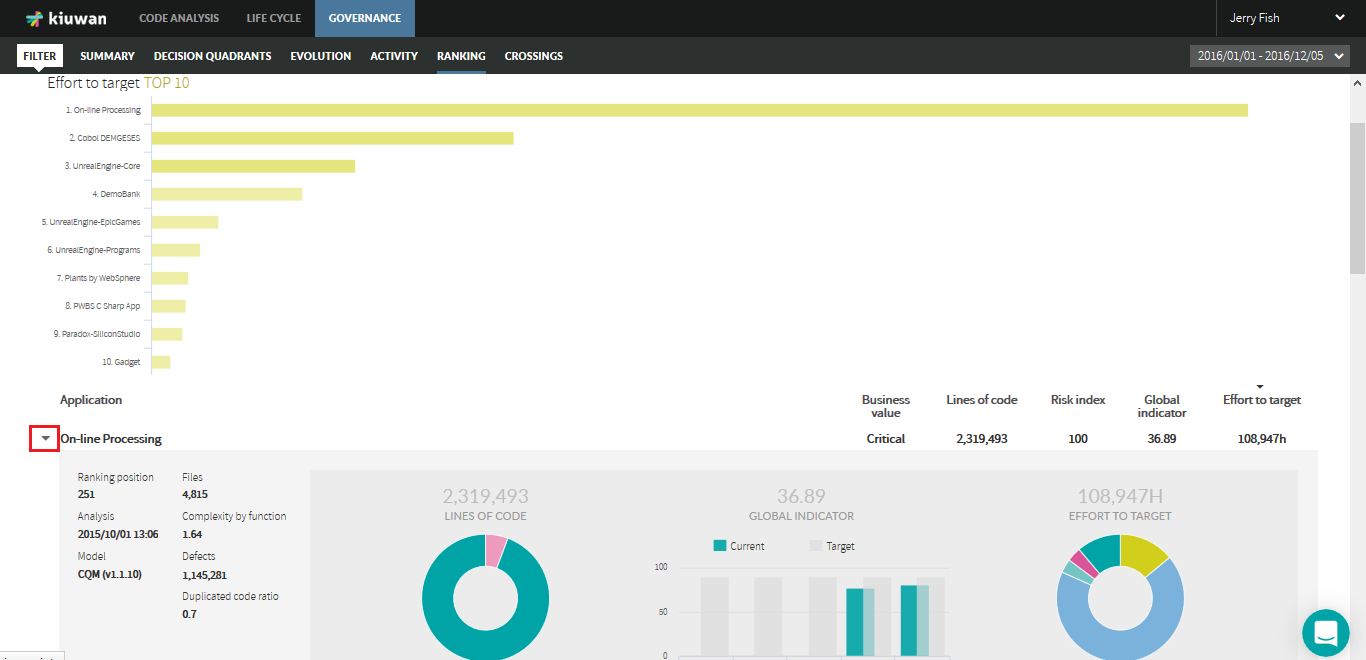
Information for the selected application includes:
- The number of files in that application.
- The lines of code that application has.
- The values of the quality main indicators:
- Effort to target
- Quality indicator
- The position of that application in the ranking, depending on its quality.
- The distance to the top, measured in quality values.
- The date of the last analysis run.
- The quality model used in that last analysis.
- The value of the complexity by function.
- The number of defects found and the number of the ones muted, if any.
- The duplicated code ratio.
- The graphing of the quality main indicators mentioned above.
- The graphing of the distribution in languages of the lines of code.
Portfolio Ranking
You can rank portfolios using Group by combo and selecting a portfolio.
Ranking page will show then portfolios ordered by selected criteria.
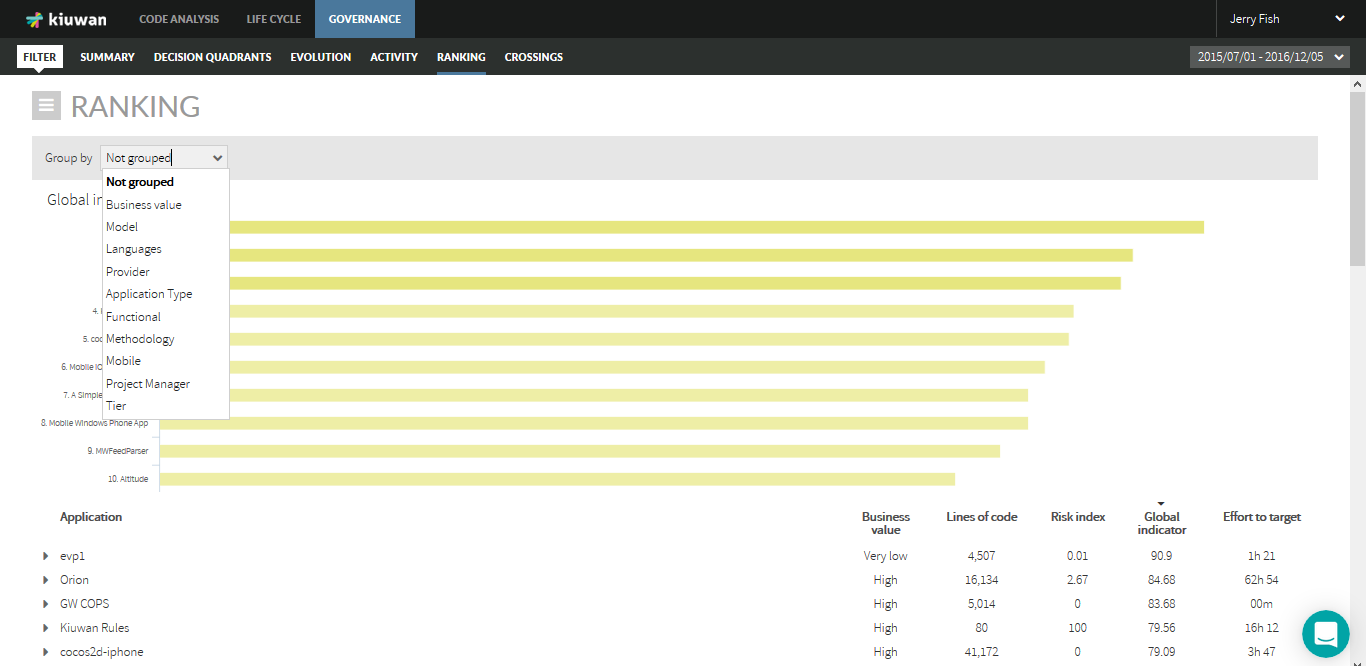
What is this used for?
For example, let's suppose that all applications are assigned to a Provider. It would be very interesting to know, for example, which are the providers con higher technical debt.
You can do it selecting the "Provider" portfolio in the "Group by" combo.
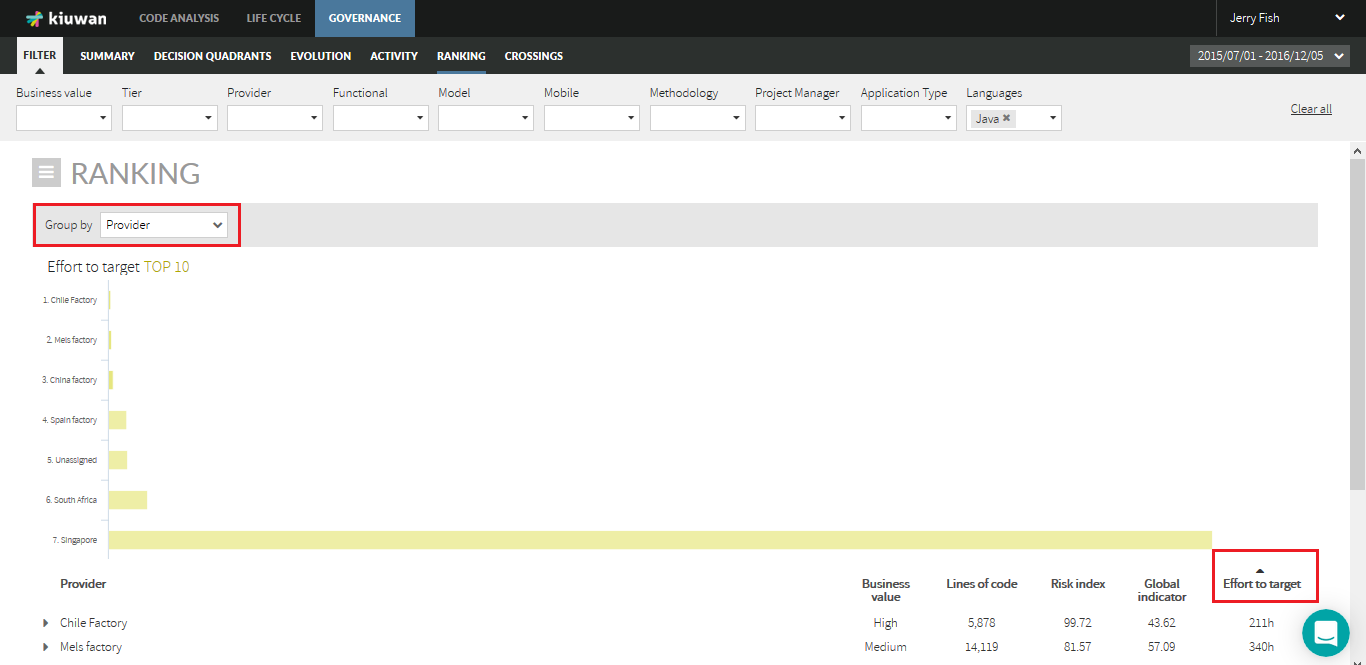
In this way, you know at a first glance a ranking of providers based on technical debt.
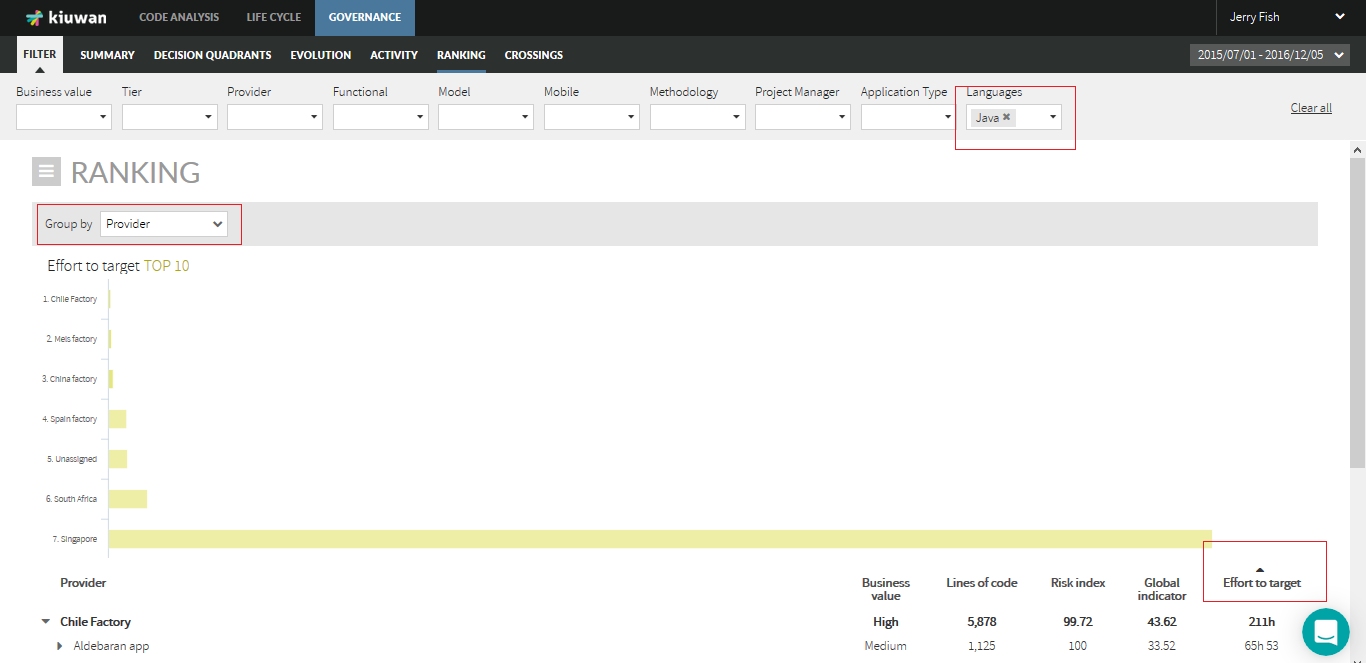
You can also use filters to add more conditions to the selected criteria.
For example, your company is going to develop a Java application and you need to know the provider with lower technical doubt in Java. That provider would be the first candidate to assign the development.
To do it, you can use filters as the picture shows.
When you have selected a portfolio to group the applications, clicking on the right arrow of a portfolio will show the applications contained in that portfolio.
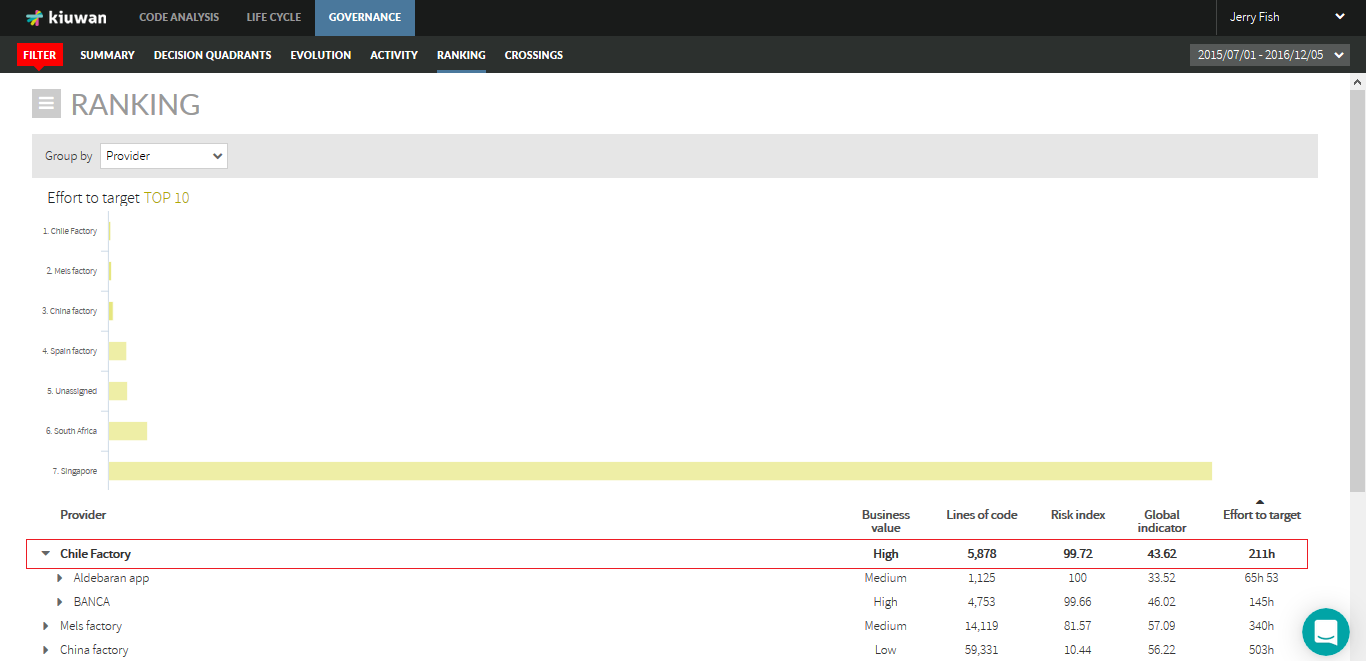
Portfolio rows display the aggregated value of the portfolio based in the contained applications.
Portfolio values are calculated as follows:
- Lines of code and Effort to are calculated as addition of apps' values.
- Risk index, Global indicator and Business value are weighted means based on apps' lines of code.
As above mentioned, clicking on the right arrow of an application will display the metrics of last analysis.