Contents:
Related pages:
KOP Administrators
There are two KOP "administrators"
- sysadmin
- access to KOP sysconsole, with functionalities related to monitoring and tuning KOP execution
- kiuwanadmin
- access to Kiuwan "functional" administration modules such as Users, Applications and Model Management (see Admin Guide )
This System Administration Guide is addressed to sysadmin user.
Please refer to Kiuwan Admin Guide for Kiuwan functional administration guide.
SysAdmin Console
SysAdmin Console
System administration user (sysadmin) has access to SysAdmin Console :
http://<$KIUWAN_HOST>:<$KIUWAN_PORT>/saas
Please note that SysAdmin console use the same URL that KOP URL, just login in as sysadmin and SysAdmin Console will appear.
Sysadmin console provides access to following functionalities:
- System Administration page
- Account Management
- Analysis Administration
- Insights Administration
- Support
System Administration page is the default page when you log in to SysAdmin Console.
All the other options are available through drop-down menu.
System Administration
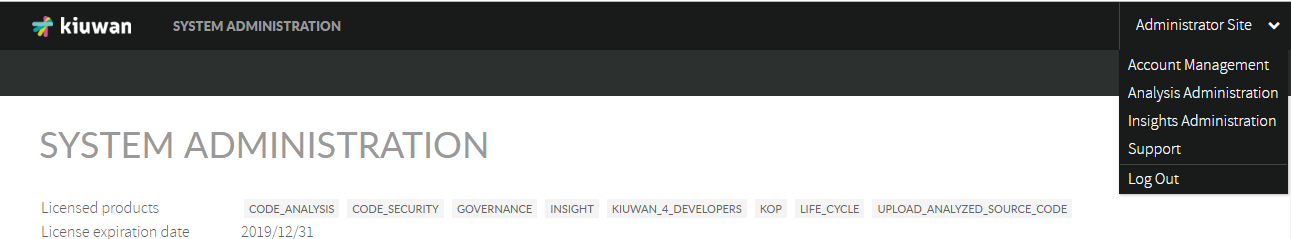
Onle you log in into SysAdmin Console, System Administration page is displayed
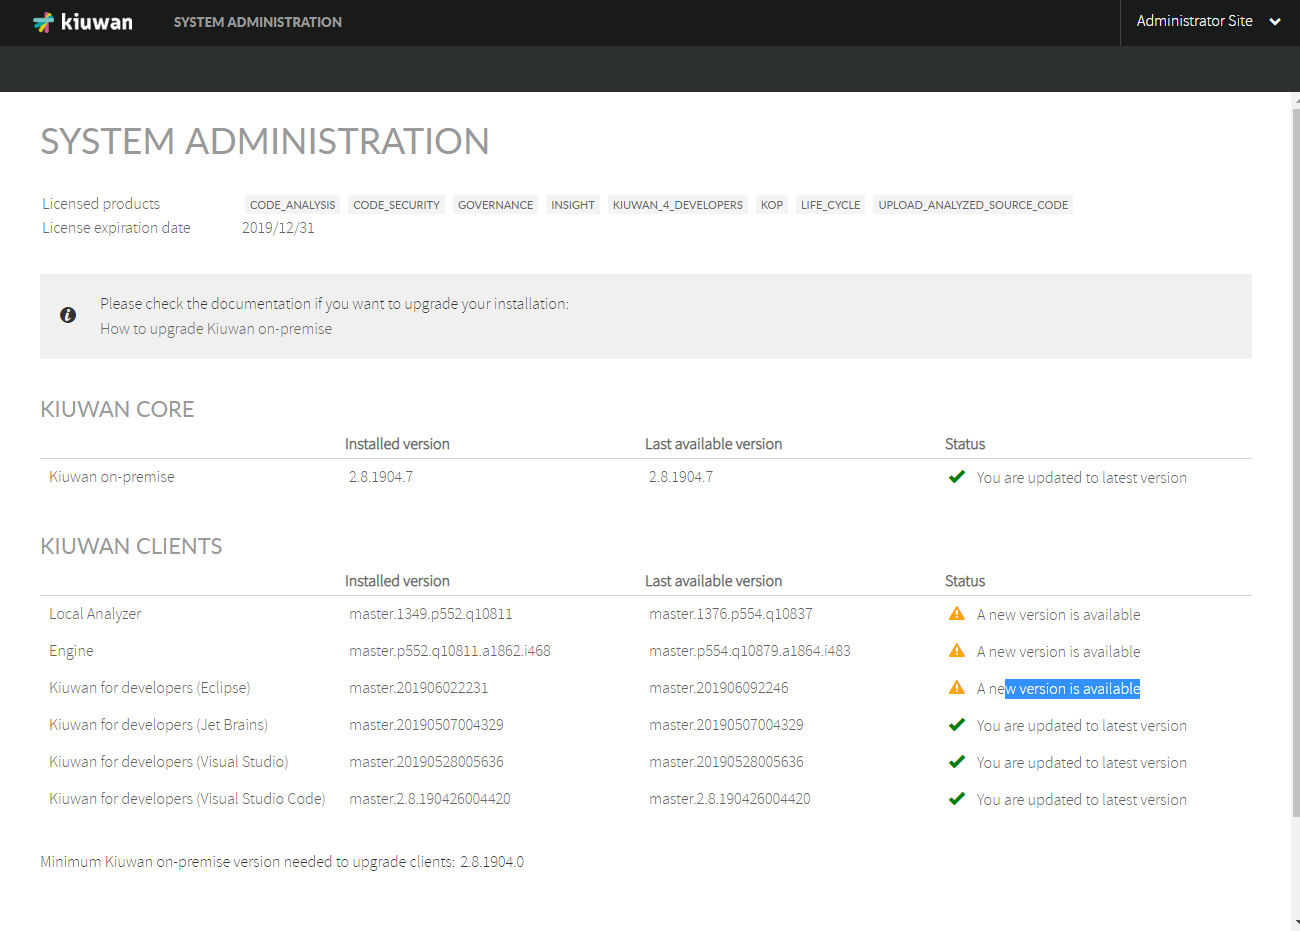
System Administration page display following contents:
- Licensed products
- A list with licensed products for your KOP installation
- License expiration date
- Expiration date for your KOP license
- Kiuwan Core
- Installed version and Last available version for Kiuwan Core
- In case your installed KOP version is not the last available, you may decide to upgrade.
- For instructions on upgrade your KOP installation, please visit Upgrading your KOP installation
- Kiuwan Clients
- Installed version and Last available version for each of Kiuwan Clients ( Kiuwan Local Analyzer, Kiuwan Engines and Kiuwan 4 Developers for supported IDE's)
- In case of any installed KOP client is not the last available, you may decide to upgrade.
- For instructions on upgrade your KOP installation, please visit Upgrading your KOP installation
- Minimum KOP version needed to upgrade clients
- There are some dependencies between Kiuwan Clients and Core.
- This field indicates the minimun KOP Core version needed to be installed in order to upgrade the KOP Clients.
- If your KOP current version is older thant the minimun required, you need to upgrade Kiuwan Core.
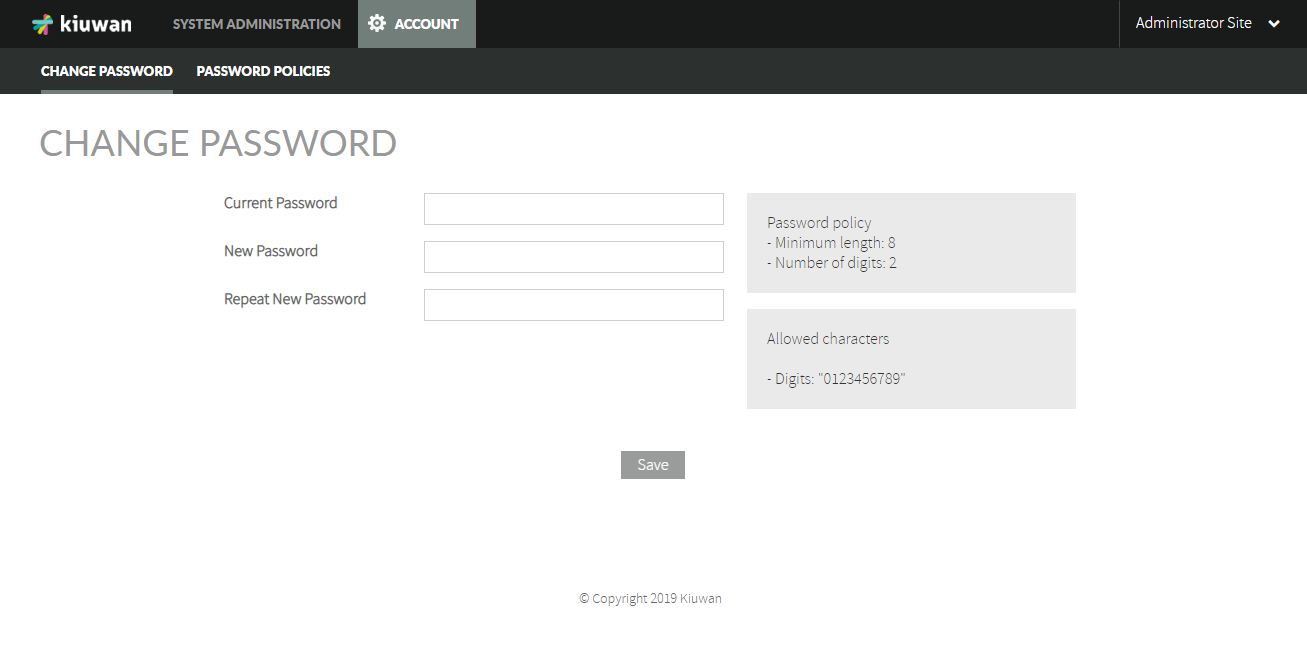
Account Management
Account Management page lets you to change the password for sysadmin user.
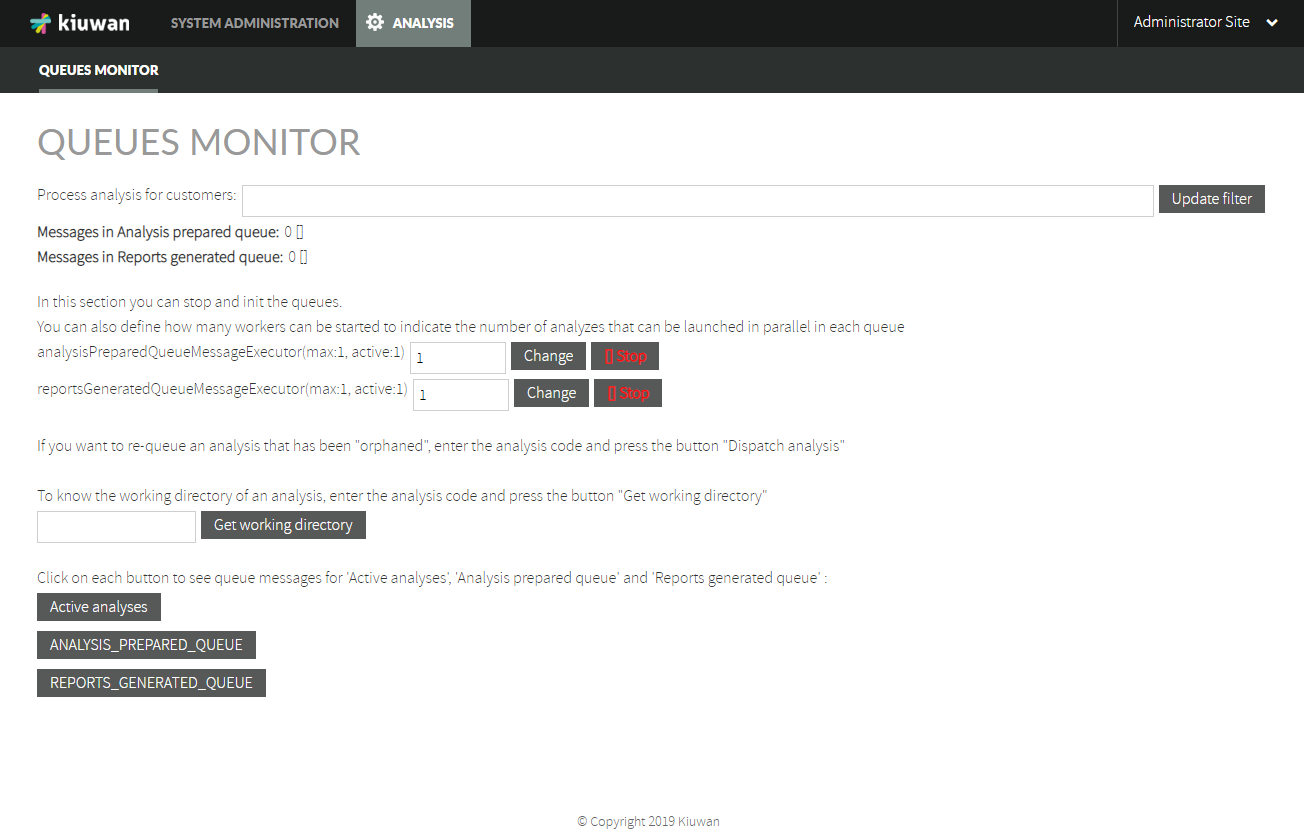
Analysis Management
Analysis Management page lets you access Queues Monitor
A complete Kiuwan analysis involves two-phases:
- 1st Phase - Local Analysis
- KLA analyzes source files and upload reports to Kiuwan
- 2nd Phase - Cloud Metrics Calculation
- Indicators and metrics are calculated in the cloud based on uploaded analysis reports
KOP uses an in-memory message queue to process those reports. This message-based queue ("Reports generated queue") allows to process (and manage) analyses in an ordely fashion
Messages in this queue are processed by a JVM (executing WildFly and KOP application).
By default, the queue is attended by one thread in the KOP JMV.
This means that, by default, analyses are sequentially processed.
States of an analysis
Once local analysis finishes, KLA upload reports to KOP and identifies the analysis by an Analysis Code (e.g. A-7e2-1669fcae0cf).
Then, the analysis could be in either of two possible states:
| Analysis State | Meaning |
|---|---|
| STATIC_ANALYSIS_FINISHED | (1) The local static analysis is finished and results are waiting to be processed (to calculate indicators) |
PARSING_REPORTS | (2) The analysis reports are currently being processed (in progress) |
Messages in the queue
Queue monitor displays the number of messages in the Reports Generated Queue.

This means the number of analyses waiting to be processed.
If this number is constantly greater than 0, that means that there's a bottleneck and you (as sysadmin) should increase the throughput to avoid waiting states.

As said above, by default the KOP JVM listen to the message queue with 1 thread. You can configure the max number of threads by introducing an upper value and click on Change button.
Also, you can stop processing by clicking on Stop button.
Active Analyses
By clicking on Active Analyses button, the queue monitor will display ALL the active analyses, regardless of their state (STATIC_ANALYSIS_FINISHED and PARSING_REPORTS).
REPORTS_GENERATED_QUEUE
By clicking on REPORTS_GENERATED_QUEUE button, the queue monitor will display only the analyses waiting to be processed (i,e STATIC_ANALYSIS_FINISHED).
Dispatch selected Analysis
As said before, messages queues are maintained in memory (in Redis). But, message sates are also maintained in ddbb (MySQL).
Sometimes, Redis and MySql might get unsync'd. This is not frequent, but after some crash of JVM (for whatever reason) you could get this situation.
The most frequent unsync situation might be that an analysis is in PARSING_REPORTS state (in MySql) but it's not currently being processed (you will see that is not "red" in Active Analyses table.
This would mean that analysis is "orphaned".
In this case, the analysis needs to be manually enqueued.To do it, just check the analysis and click on Dispatch selected analysis. This action will re-enqueue the analysis.
Support
Support page allow s to collect most important log files of KOP installation for troubleshooting purposes.
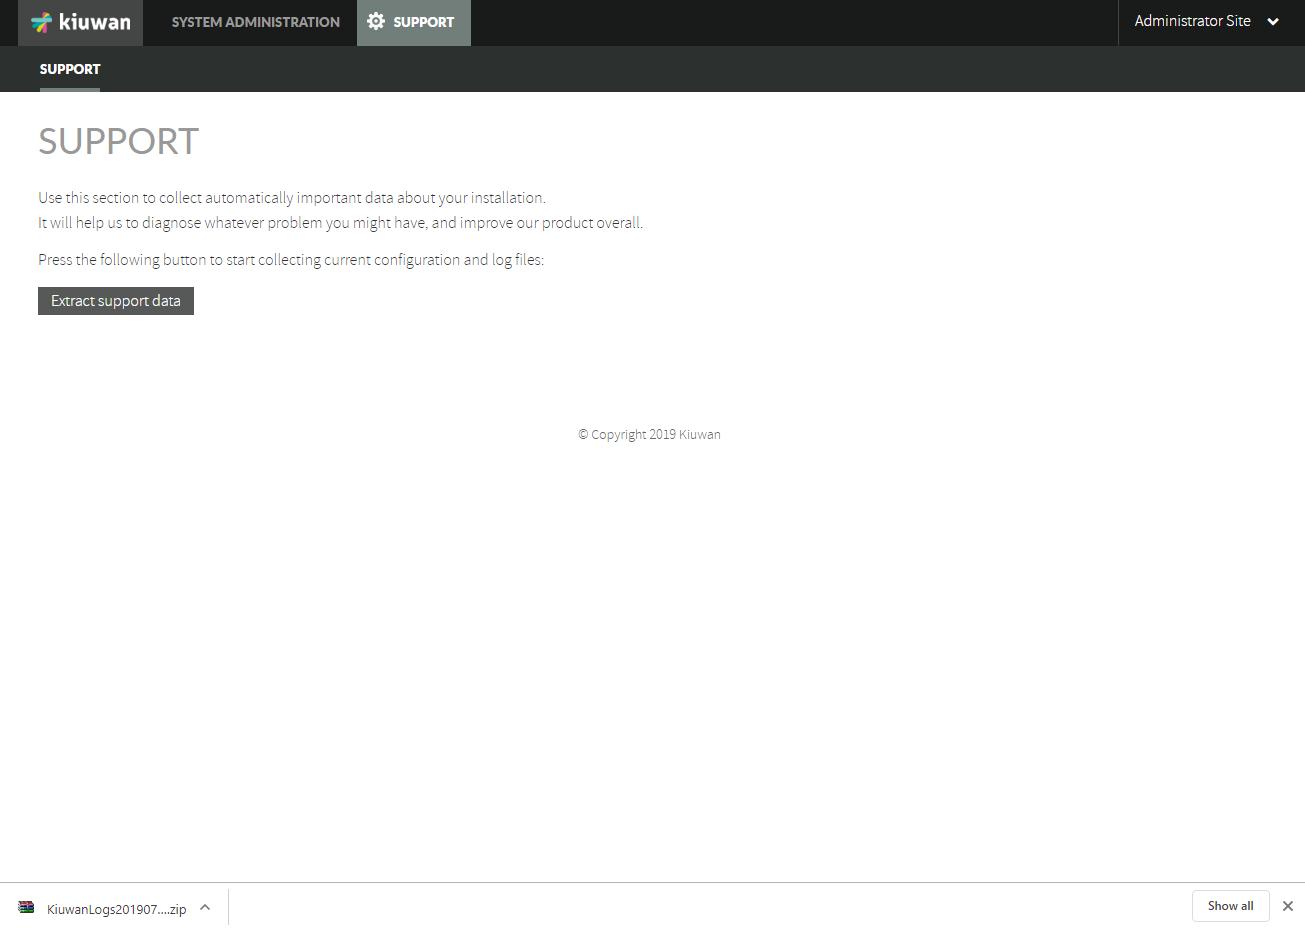
By clicking on Extract support data, you will obtain a zip file with most relevant log files.