Insights >> Security
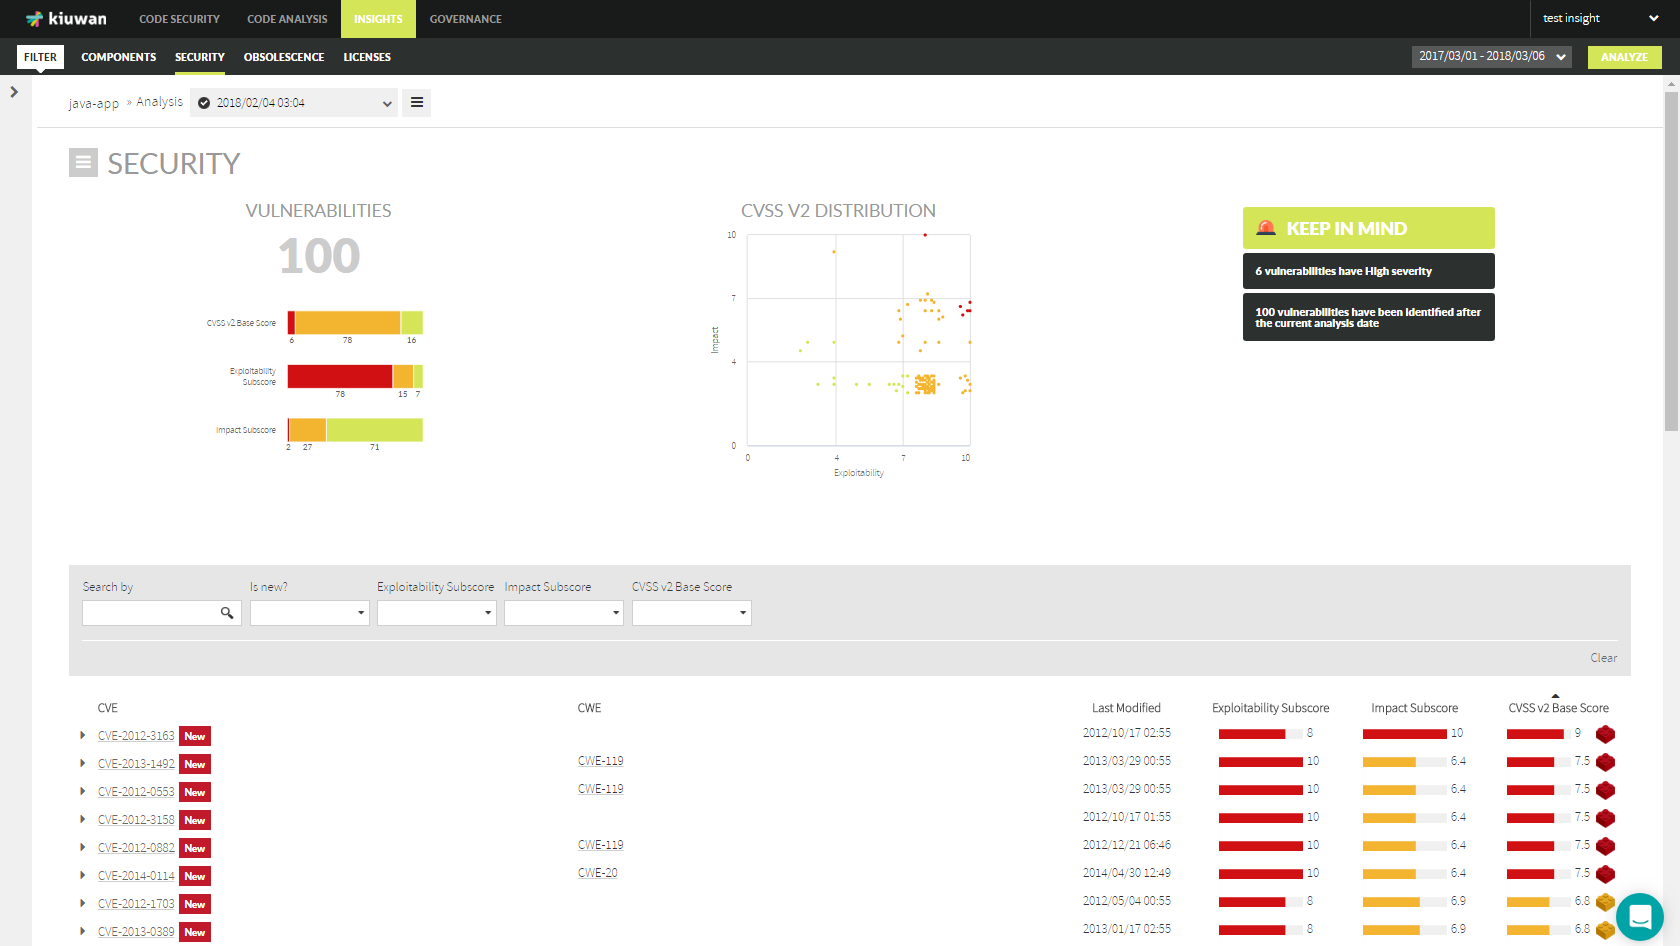
Insights >> Security displays security information on vulnerabilities found in components.
Information on components’ Security is accessible through Insights >> Security tab.
Security Risk
With Kiuwan Insights you can easily detect those components that have well-known security vulnerabilities.
For every external component, Kiuwan Insights searches for vulnerabilities reported to NIST‘s National Vulnerability Database (NVD) (https://nvd.nist.gov/)
If Kiuwan finds any reported vulnerability of your component, it will display the details of the vulnerability and score the component in a Security Risk indicator.

Security Risk Indicator
A component’s Security Risk is based on CVSS v2 Base Scores (Severities) of its vulnerabilities:
- If the selected component has more than one vulnerability, Kiuwan will label the component with the highest severity value of all the vulnerabilities of the component.
- If the selected component has only one vulnerability, the Severity of that vulnerability will be the Security Risk of the component.
For example, let’s suppose your app is using Struts TagLib 1.3.8. Kiuwan will display next information:
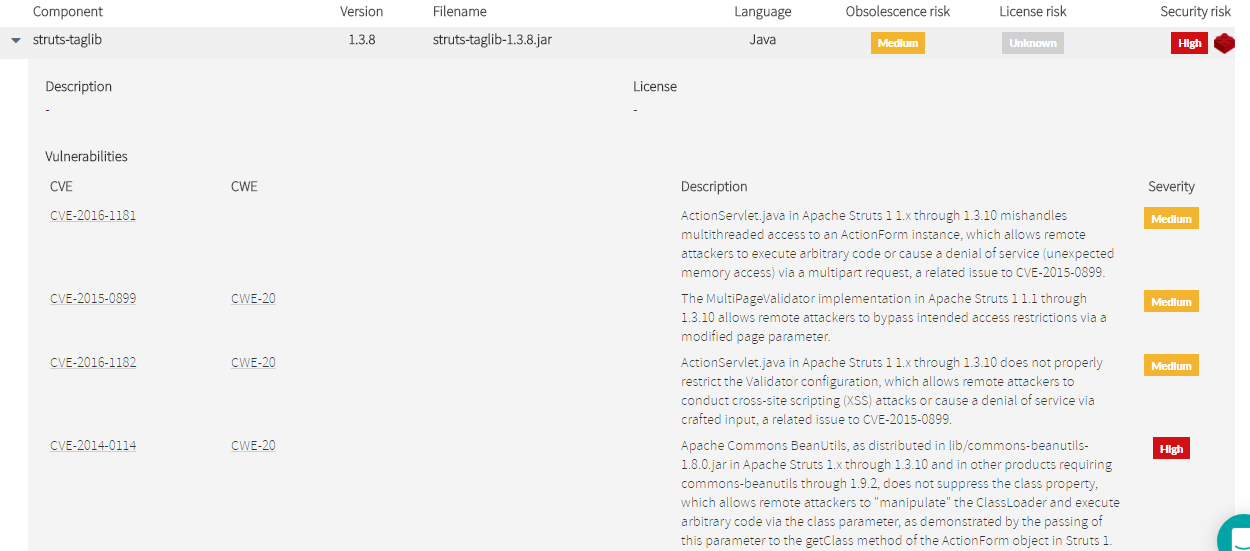
Struts TagLib 1.3.8 has 4 known vulnerabilities, three are considered as Medium and one as High. Therefore, Kiuwan will mark Struts TagLib 1.3.8 as High.
Security Risk indicator of a component is displayed as a label based on its numeric value (from 0 to 10):
Security Risk Indicator | |
Value | Label |
0 |  |
( 0 , 4 ] | |
( 4 , 7 ] |  |
( 7, 10 ] |  |
Common Vulnerability Scoring System (CVSS) v2
CVSS v2
For every vulnerability, CVSS v2 provides an overall Base Score that “represents the intrinsic and fundamental characteristics of a vulnerability that are constant over time and user environments” (https://www.first.org/cvss/v2/guide)
CVSS v2 Base Score
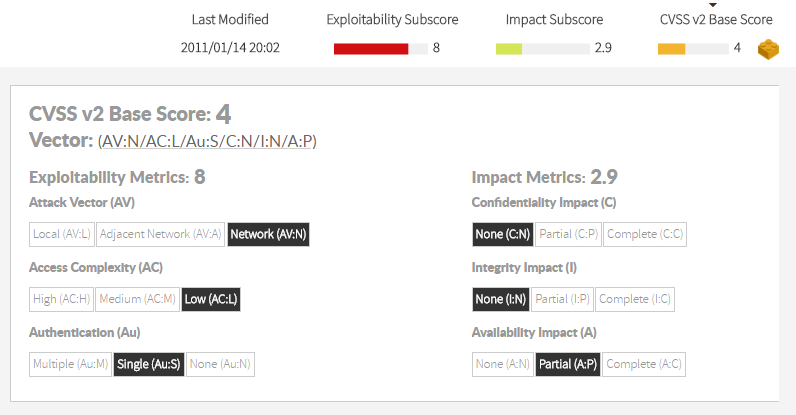
Base Score is based on two main characteristics (modeled as Subscores) of any vulnerability (with associated metrics):
- Exploitability Subscore : degree of difficulty to access and exploit the vulnerability
- Impact Subscore : if exploited, how important would be the consequences
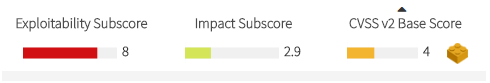
Base Score, as well as Exploitability and Impact subscores, are displayed as a numeric range from 0 to 10, with associated color based on its importance ( “the higher, the worst” )
CVSS v2 Scores | |
Value | Label |
[ 0 , 4 ] |  |
( 4 , 7 ] |  |
( 7, 10 ] |  |
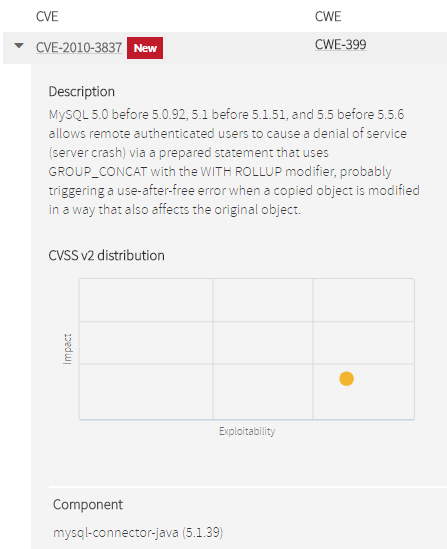
Kiuwan Insights provides a 2-axis figure that can help you to easily understand these two important characteristics of the vulnerability.
- The more close to the left a vulnerability is, the easier will be to exploit it.
- The more close to the top a vulnerability is, the more important will be its consequences.
Base Score is calculated as a function of Exploitability and Impact Subscores.
Exploitability and Impact subscores are calculated from their associated metrics.
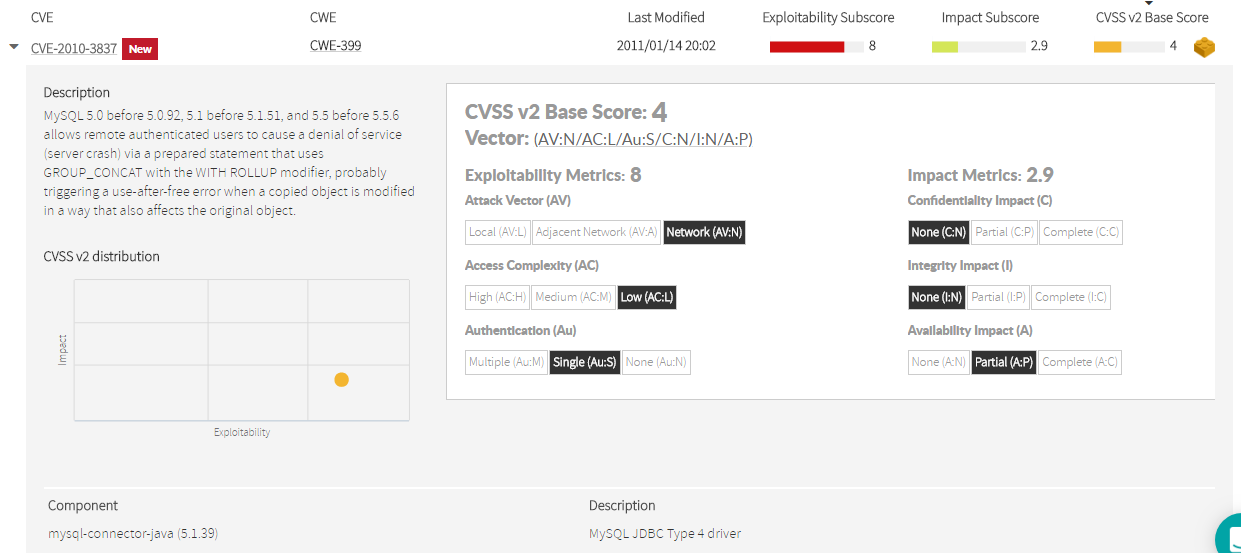
Kiuwan Insights displays the value for every subcore’s metric.
Below you can find the meaning for every metric but, as a rule of thumb, you can consider that the more left is the value of the metric, the more dangerous is the vulnerability.
Let’s understand the meaning of every metric.
Exploitability metrics
- Attack Vector (AV) : This metric reflects the level of “proximity” the attacker needs to obtain to the system in order to exploit the vulnerability. The more remote an attacker can exploit the vulnerability, the more vulnerable the system is.
- Values : Local - Adjacent - Network ( L / A / N )
- Access Complexity (AC) : Once the target system is reached, this metric reflects the complexity required to exploit the vulnerability (relative to the existence of “barrier conditions”). The easier to exploit the vulnerability, the more vulnerable the system is.
- Values : Low – Medium – High ( L / M / H )
- Authentication (Au) : This metric reflects the number of time the attacked needs to authenticate before being able to exploit the vulnerability. The less times he needs, the more vulnerable the system is.
- Values : Multiple – Single – None ( M / S / N )
Impact metrics
- Confidentiality Impact (C) : This metric reflects the degree in which the vulnerability can read system data and produce confidential information disclosure to non-authorized users.
- Values : None - Partial - Complete ( N / P / C )
- Integrity Impact (I) : This metric reflects the degree in which the vulnerability allows the attacker to modify existing system data, compromising the trust and veracity of data.
- Values : None - Partial - Complete ( N / P / C )
- Availability Impact (A) : This metric reflects the degree in which the vulnerability affects the availability and use of the system.
- Values : None - Partial - Complete ( N / P / C )
Values of above metrics are combined to calculate CVSS v2 Base Score and Exploitability / Impact Subscores as described at https://nvd.nist.gov/vuln-metrics/cvss/v2-calculator
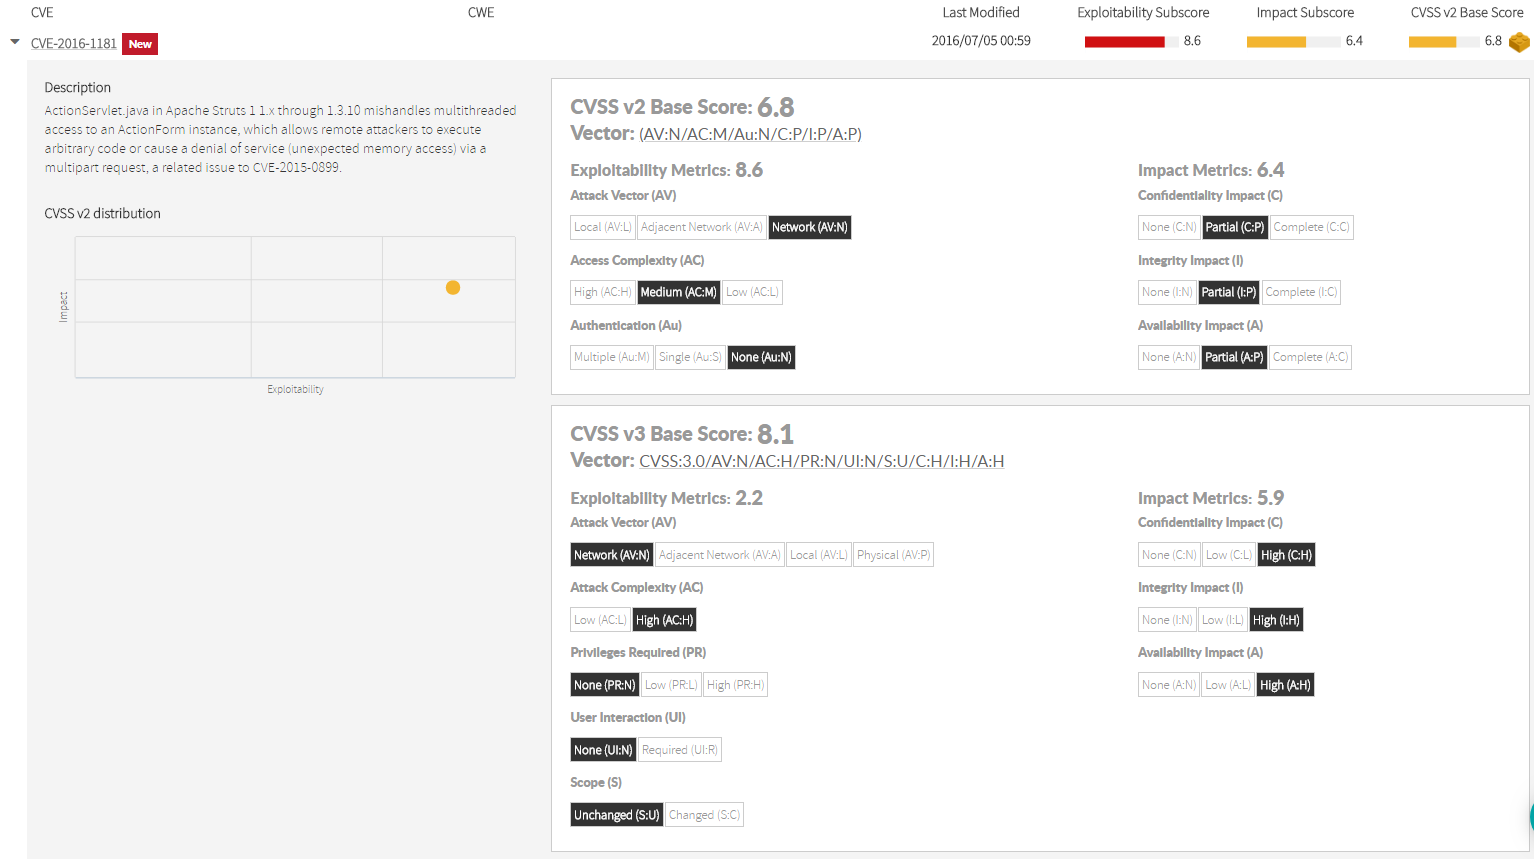
Common Vulnerability Scoring System (CVSS) v3
CVSS v2 has evolved to v3 (https://nvd.nist.gov/vuln-metrics/cvss/v3-calculator) introducing changes to metrics (new metrics and different possible values).
However, not all vulnerabilities reported to NIST‘s National Vulnerability Database (NVD) have been scored according to v3 guidelines. Indeed, only a subset of them has been re-scored.
Because of this, although Kiuwan Insights displays v3 data (when available), only v2 data will be used when computing components’ Security Risk indicator.
New vulnerabilities
NIST database is continuously being feed with new vulnerabilities.
What happens if, after the date you run the analysis, new vulnerabilities are found that affect some of your components?
Don’t care. Kiuwan Insights is continuously inspecting NIST database for new vulnerabilities.
If there are new vulnerabilities that affect some of the components of your app, those components will display those new vulnerabilities (marked as New) without the need to run a new analysis.
Kiuwan will keep your components inventory up-to-date without the need to run new anlyses.
