This page explains the Summary section in Kiuwan Governance.
Contents:
Summary Description
Governance Summary is a comprehensive aggregated view of your application portfolio.
It provides global analytics data that will help you to gain insights about your applications and let you inspect global values and trends based on data collected from your analysis.
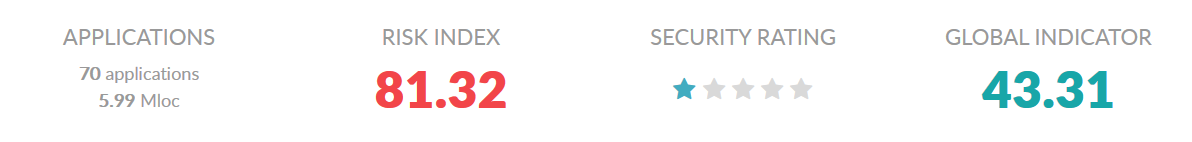
Depending on the selected data range, it summarizes application data providing global values for the most important Kiuwan indicators:
- Number of Applications and Global Size
- Risk Index (a measure on how far you are to get acceptable security and quality level, based on Global Indicator, Effort to Target and Applications Size)
- Security Rating (a 5-start grade that indicates how secure your applications are)
- Global Indicator (a general index based on software characteristics such as security, efficiency, maintainability, reliability, and portability)
- Technical Debt (a global effort measure to correct all the detected defects)
Please visit Security and Quality Indicators for more information on Kiuwan Indicators.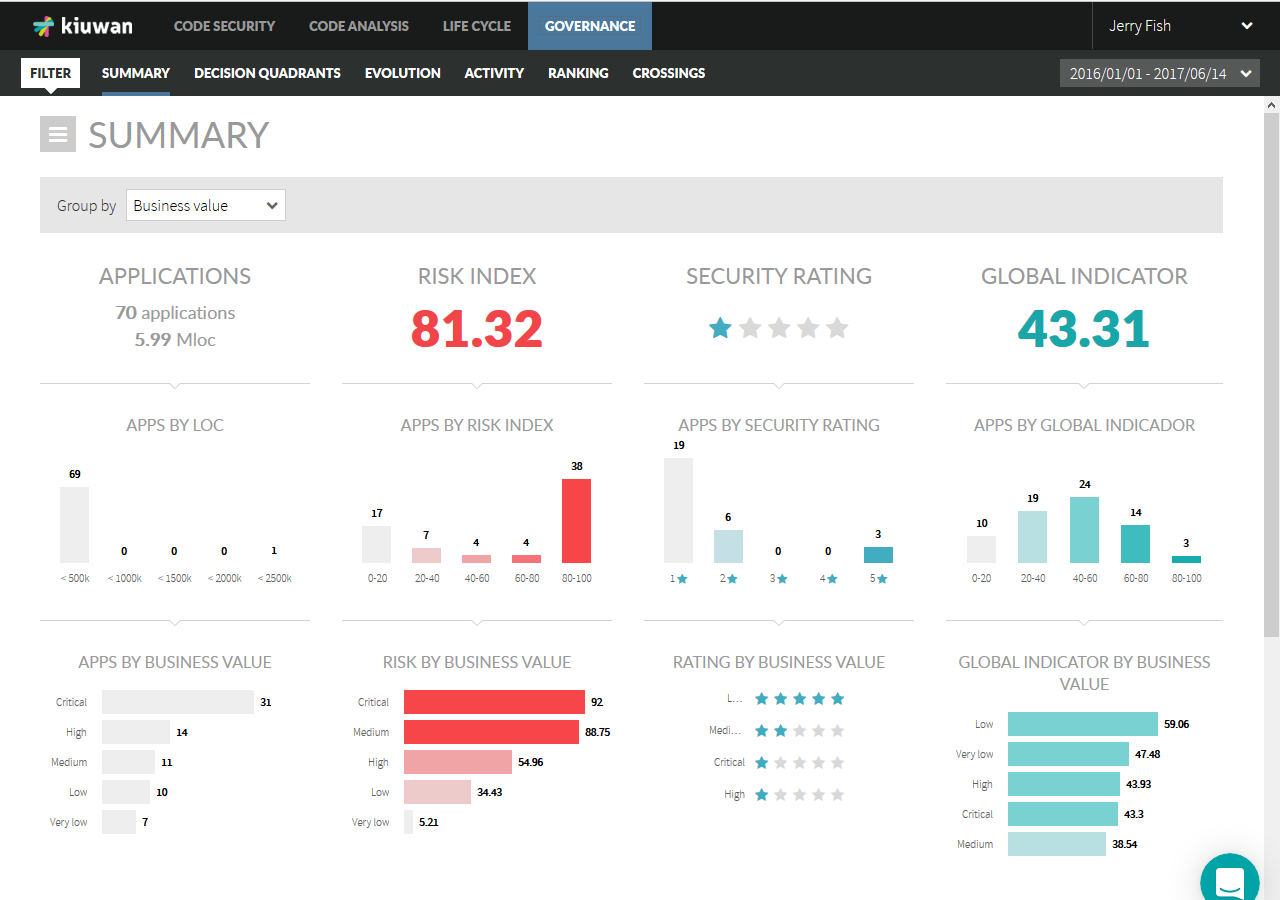
Summarized Data
The Governance Summary page displays the following data:
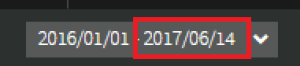
Summarized data is based on the calendar's selected dates (it will consider available data up to selected data range).
Summarized Indicators description
(please visit Security and Quality Indicators for more information on Kiuwan Indicators)
| Indicator | General Description |
|---|---|
Applications | Total number of Applications and Size (in LOCs) It's calculated as how many application exists up to the selected date range (an app "exists" if there are analysis on it up to the selected date) Size is calculated as the sum of the last analysis's LOC for selected applications. |
Risk Index | Kiuwan’s Risk Index (RI) is a summary indicator that provides a measure of the implicit risk associated with the security and quality aspects of your application, according to your defined requirements (targets). It provides a measure of how far you are to get acceptable security and quality level ( remember that the exact meaning of “acceptable” is defined by you - the “target”). Risk Index calculation concentrates all the evidence found in the source code of your application, and it is calculated combining Global Indicator (GI), Effort to Target (E2T) and Application Size. Summarized Risk Index is calculated as an average of Risk Indexes (weighted by App`s Size) of selected apps. |
Security Rating | Security Rating, a 5-star grade that indicates how secure your applications are in terms of the likelihood and impact of found security vulnerabilities. A security rating of 5 stars is considered to be secure, whereas 1 star is considered to be very insecure. Visit Kiuwan Code Security for further information on Kiuwan Security Rating and Vulnerability types. Summarized Security Rating is calculated based on the greatest common divisor (gcd) approach of the security ratings of the selected applications. For example, If you have 3 apps with 5-, 4- and 1-star ratings, you Global Sec Rating will be 1-star. |
Global Indicator | Global Indicator is a general index based on Software characteristics (ISO-25000 based), such as Security, Efficiency, Maintainability, Reliability, and Portability. It's a weighted average of those software characteristics, providing an accurate global metric for the whole application. Global Indicator is calculated through a complex algorithm that takes into account the severity of the defects, the weight of the category, the analyzed code volume and the criticality of the different programming languages. Summarized Global Indicator is calculated as an average of Global Indicators (weighted by App`s Size) of selected apps. |
Distribution of Applications
Besides summarized indicators, the Governance Summary also provides a distribution of your account's applications according to the following criteria.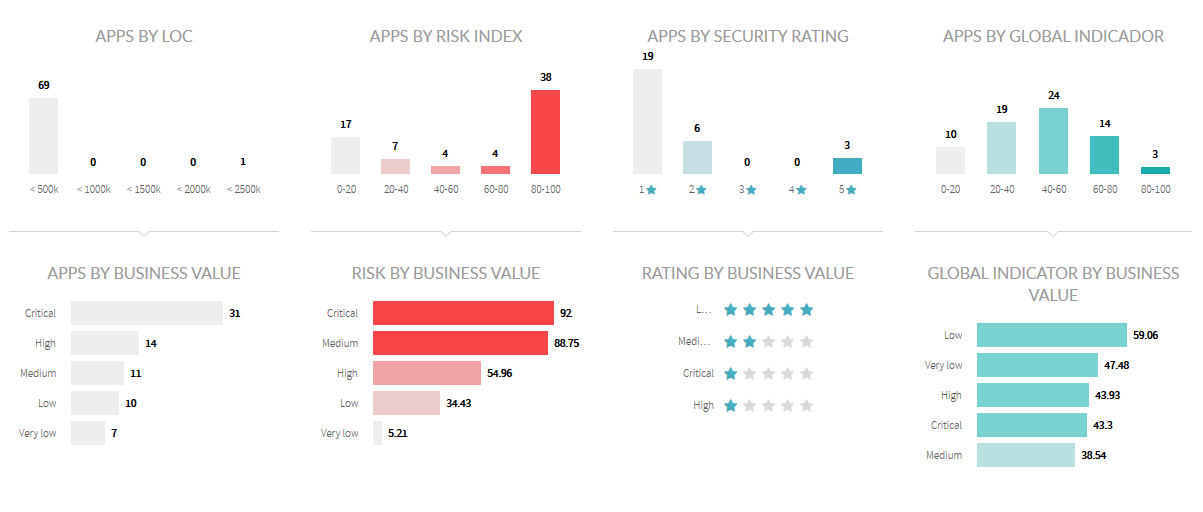
| Name | Description |
|---|---|
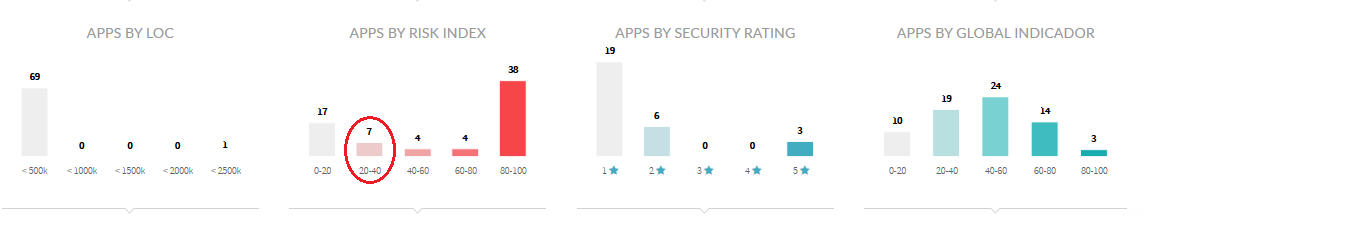
Apps By Size | A histogram displaying the distribution of apps (frequency) according to 5 size ranges. Size intervals (5) are calculated from 0 to max size. |
Apps By Risk Range | A histogram displaying the distribution of apps (frequency) according to 5 ranges for Risk Index:
|
Apps By Sec Rating | A histogram displaying the distribution of apps (frequency) according to Security Rates (1- to 5- stars) This distribution is based on original apps security rates. For example, most of your apps have 3 stars but the Summarized Security Rating is 1. This is due to the algorithm applied to Summarized Security Rating calculus. Summarized Security Rating is not an average. It's calculated based on the greatest common divisor (gcd) approach of the security ratings of the selected applications. For example, If you have 3 apps with 5-, 4- and 1-star respectively, you Global Sec Rating will be 1-star. The Security Rating was introduced in Kiuwan by Feb-2017. Therefore, this metric is not available for analyses executed before that date. We deliberately decided not to include those apps in this grouping. Consequently, applications whose last analysis is previous to that date will not be included. You could find then that total apps in this aggregation might be less than the real number of applications. |
Apps by Global Indicator | A histogram displaying the distribution of apps (frequency) according to 5 ranges for Global Indicator
|
Drill-down of Applications
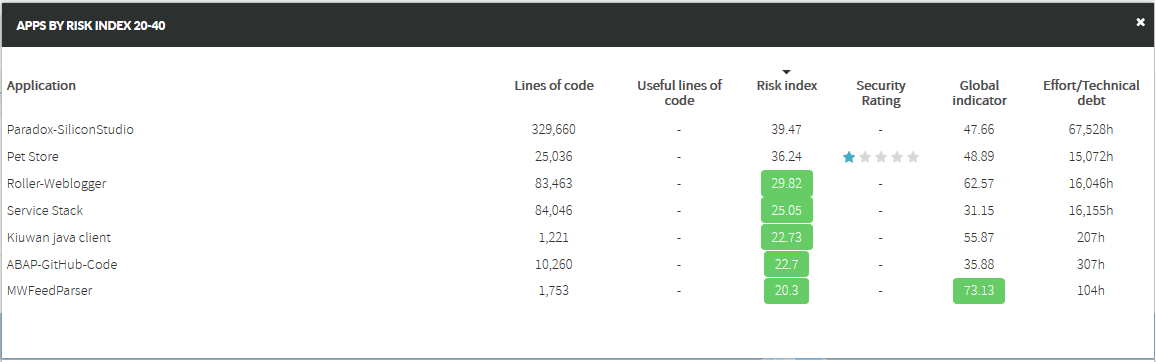
Click on a column of any histogram to get the details of the applications that match the selected criteria.
For example, click on Apps By Risk Index in the 20-40 range
to get the details of the applications with a Risk Index between 20 and 40
Grouped By Aggregated data
Besides Summarized indicators (as shown above), you can select how to group aggregated data based on your available Portfolios.
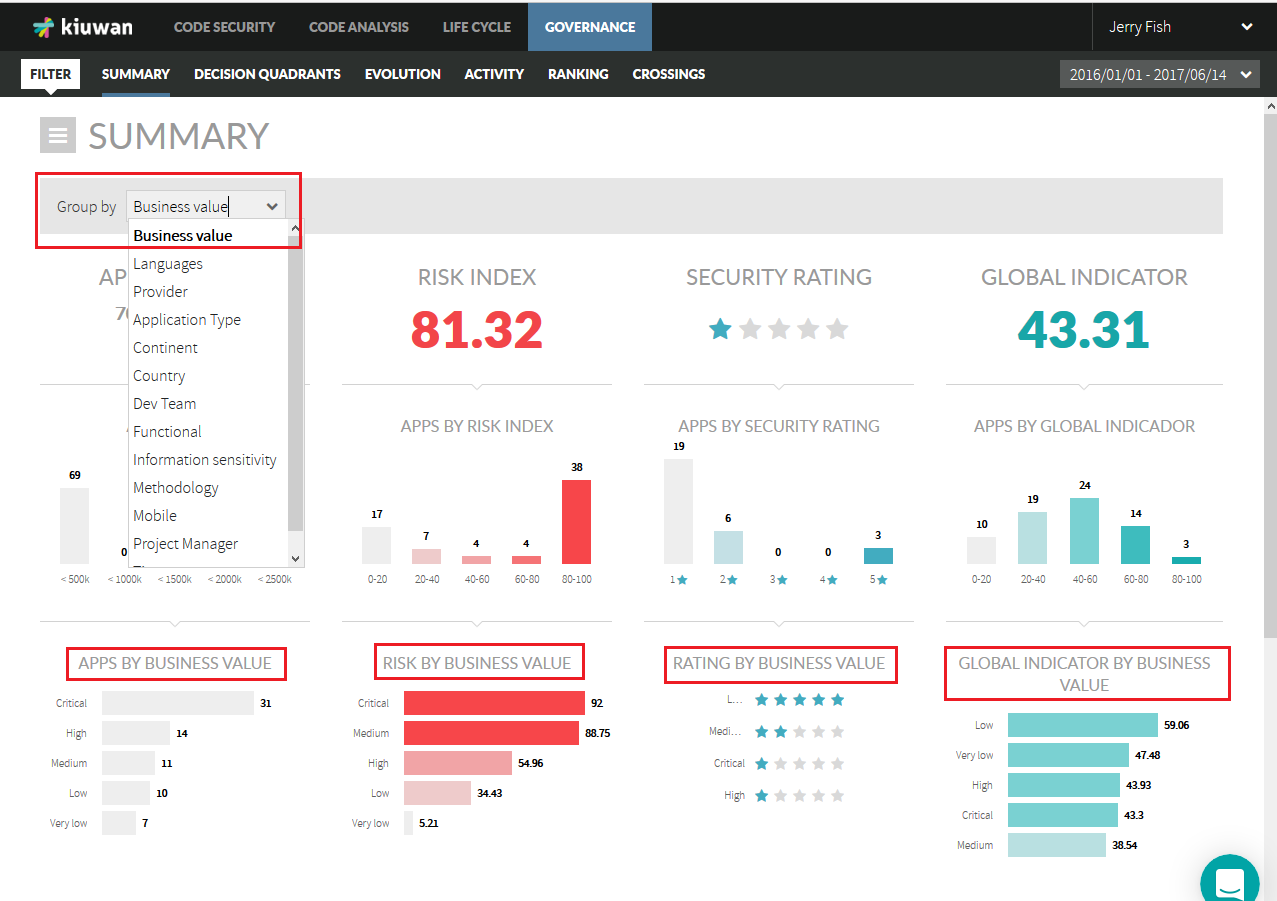
The Group By selector will present to you all the available Portfolio Groups defined in your Kiuwan account.
Select one of them, and the graphics will show an indicator for every one of the available Portfolio Values for the selected Portfolio Group.
As an example, if you select Business Value, the data will show indicators for the different values of Business Value portfolio (Critical, High, Medium, etc.)
Similarly, you could select any other of the available portfolio groups.
For didactic purposes, the next explanation will take Business Value as an example portfolio.
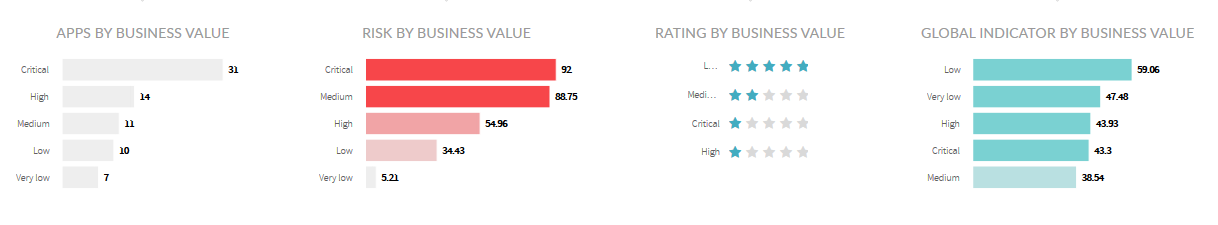
Apps By Business Value | It will show how many applications belong to Critical, High, Medium, Low and Very Low. Ordering will be based on higher-to-lower frequencies. It's worth to mention a special case, i.e. the Languages portfolio group. This is a multi-valued portfolio automatically assigned by Kiuwan based on detected languages during the analysis. This means that, for example, if an application contains Java and Javascript files, that app will be considered as Java AND JavaScript. Therefore, you could find that the sum of apps by language is higher than the total number of applications. |
Risk By Business Value | It will show the average Risk Index for Critical, High, Medium, Low and Very Low applications. Aggregated Risk Index is calculated as a weighted average based on apps' loc size. Ordering will also be based on higher-to-lower values. |
Security Rating By Business Value | It will show the Security Rating for Critical, High, Medium, Low and Very Low applications. Ordering will also be based on higher-to-lower values. As above mentioned, please remember the special algorithm applied to Summarized Security Rating. |
Security Rating By Business Value | It will show the Security Rating for Critical, High, Medium, Low and Very Low applications. Ordering will also be based on higher-to-lower values. As above mentioned, please remember the special algorithm applied to Summarized Security Rating. |
Global Indicator By Business Value | It will show the Security Rating for Critical, High, Medium, Low and Very Low applications. Ordering will also be based on higher-to-lower values. Aggregated Global Indicator is calculated as a weighted average based on apps' loc size. |
Technical Debt
Based on selected criteria (i.e., grouped by the selected portfolio), the Technical Debt panel will show the Summarized Technical Debt for every value of the portfolio.
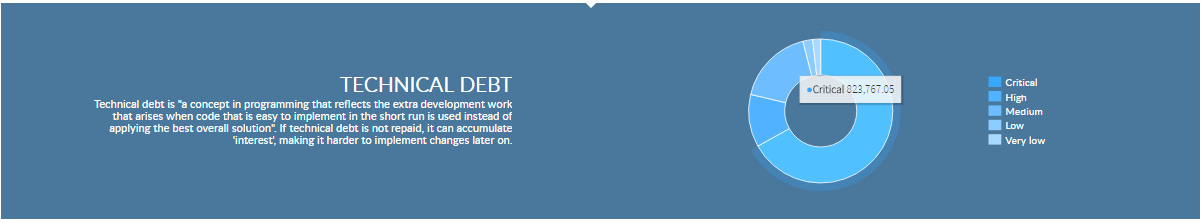
Summarized Technical Debt is calculated as the sum of selected applications' Total Effort values.
An Application Total Effort is calculated as the sum of hours that you need to spend to fix all found defects.