Summary
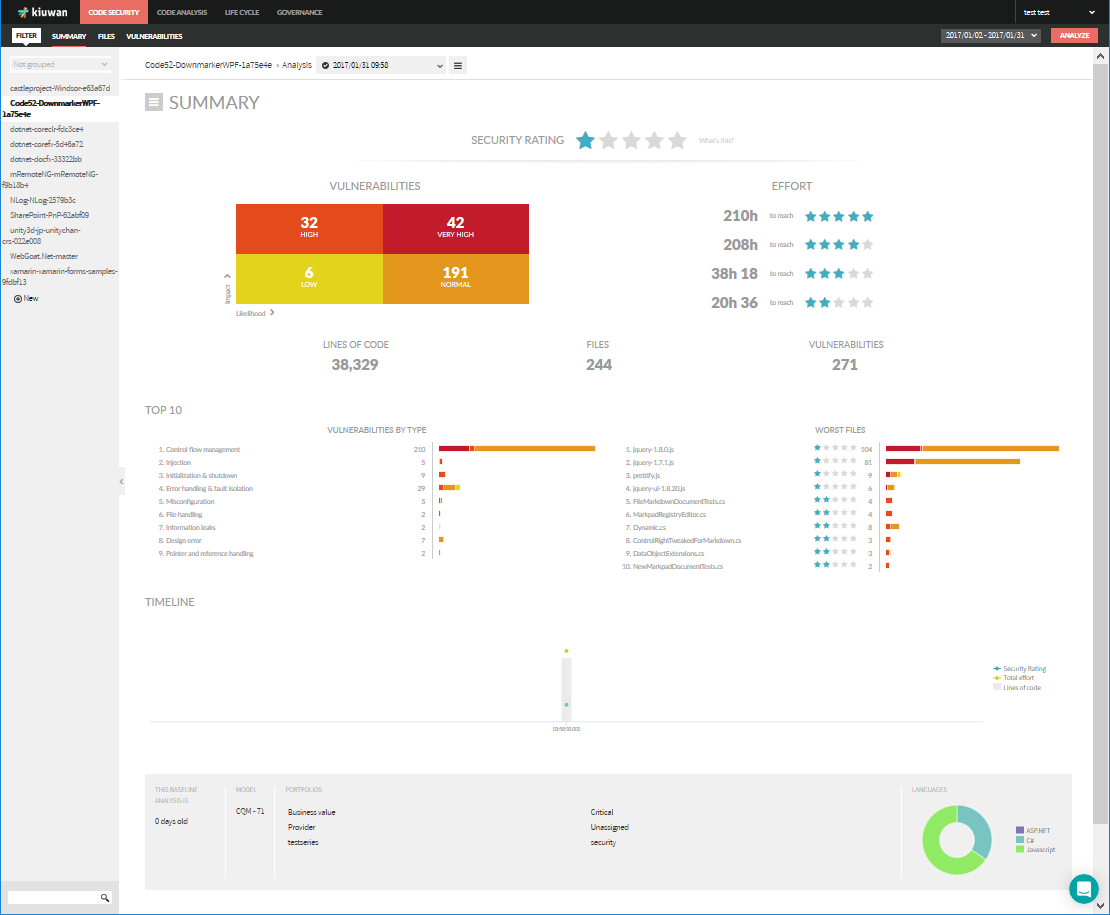
The Summary provides a comprehensive high level overview of your application security, allowing you to have a complete security dashboard of your application at your fingertips.
Summary provides:
- Overall security rating,
- Vulnerabilities quadrant,
- Effort to reach upper levels of security,
- Top-10 security vulnerabilities,
- Top-10 worst files, and
- Timeline evolution of security indicators
Security Rating
Kiuwan Security Rating is a discrete 5-star grade that tells you how secure your application is in terms of the likelihood and impact of the found vulnerabilities.
This rating concentrates all the security evidences found in the source.
<<sec-3.png>

Applications with 5 stars are considered to be secure, whereas those with 1 star are considered to be very insecur
Security Vulnerabilities
Security vulnerabilities are grouped in a quadrant according to two major axes:
- Impact of the vulnerability, according to the severity of the associated security risk
- Likelihood of the event that could cause the associated security breach
These two axes produce 4 quadrants. Kiuwan summarizes found vulnerabilities for each quadrant.
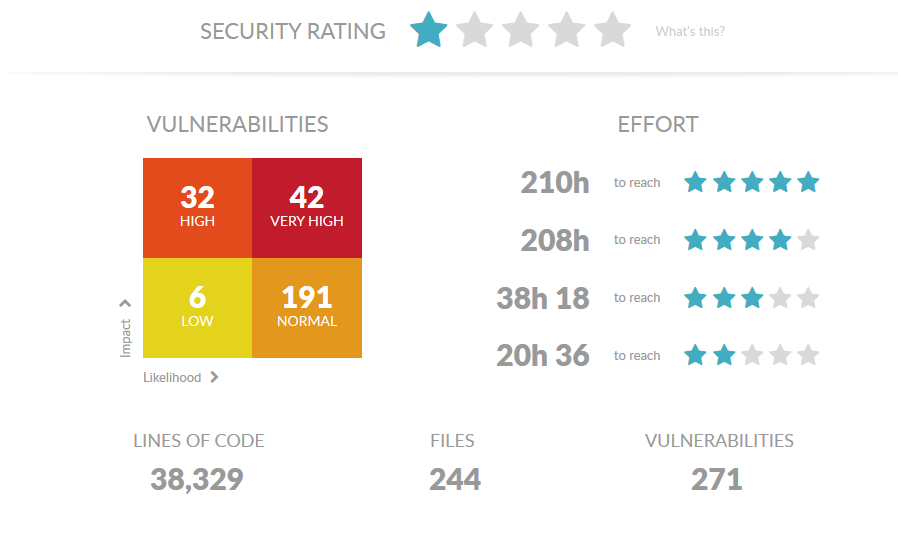
In this image, you can see that Kiuwan found 271 vulnerabilities and how kiuwan distributes them in the 4 quadrants:
- Low : likelihood and impact are both low
- Normal: likelihood is high and impact is low
- High: likelihood is low but impact is high
- Very High: both likelihood and impact are high
Security rating is based on following:
- Security Rating starts from 1-star (i.e. 0 is not considered) when there is at least 1 Very-High vulnerability (high impact, high likelihood)
- 2-star rating when there is at least 1 High vulnerability (high impact, low likelihood) and none of higher priority
- 3-star rating when there is at least 1 Normal vulnerability (high likelihood, low impact) and none of higher priority
- 4-star when there is at least 1 Low vulnerability (low likelihood, low impact) and none of higher priority
- 5-star when there are no vulnerabilities in terms of likelihood and impact for your application security
Based on analysis results, Kiuwan also calculates the Effort you need to invest to reach the different rating levels according to the remediation effort associated to fix each vulnerability.
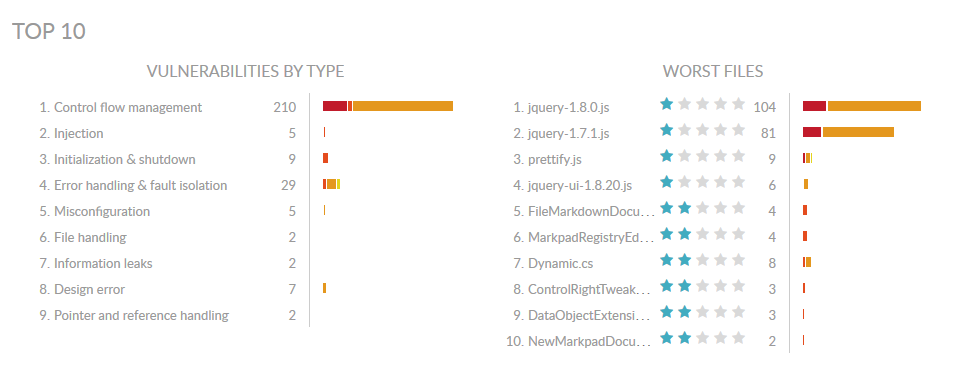
Top 10 Vulnerabilities and Worst Files
Code Security Summary also provides a Top-10 ranking of vulnerability types and worst files.
This way, you can easily concentrate on major contributors to current security rating.
Any vulnerability found by Kiuwan is categorized according to its type:
- Buffer handling
- Control flow management
- Design error
- Encryption and randomness
- Error handling and fault isolation
- File handling
- Information leaks
- Initialization and shutdown
- Injection
- Misconfiguration
- Number handling
- Permissions, privileges and access controls
- Pointer and reference handling
- System element isolation
- Other
The Top-10 Vulnerabilities By Type graphic lets you to view which ones are the most frequent in your application, showing the total number of vulnerabilities for every type.
Clicking on the vulnerability type you will be able to see associated defects (that link will forward you to Vulnerabilities page with the defects filtered by the selected type).
If you want to see which vulnerabilities are checked by Kiuwan for every type, you should go to Model Management, select your model and click on Security Rules.
The Top-10 Worst Files graphic displays a ranking of worst (low-rated) files of your application, showing the security rating and the number of vulnerabilities found.
Timeline
The Timeline section displays a historical evolution of your Security Rating and Total Effort (to reach 5-star rating) as well as the total LOC size of your application.
This section also displays information on:
- When a baseline analysis was performed (only applicable if you are using Life Cycle). If you are not using Life Cycle, that date will be current date of the analysis.
- Model used for the current analysis
- Portfolios this analysis belongs to
- Graphical distribution of LOCs in different languages