Once you are logged in or an analysis has been executed, we will find it in the "Applications >> Application Name >> Summary", in which we see: 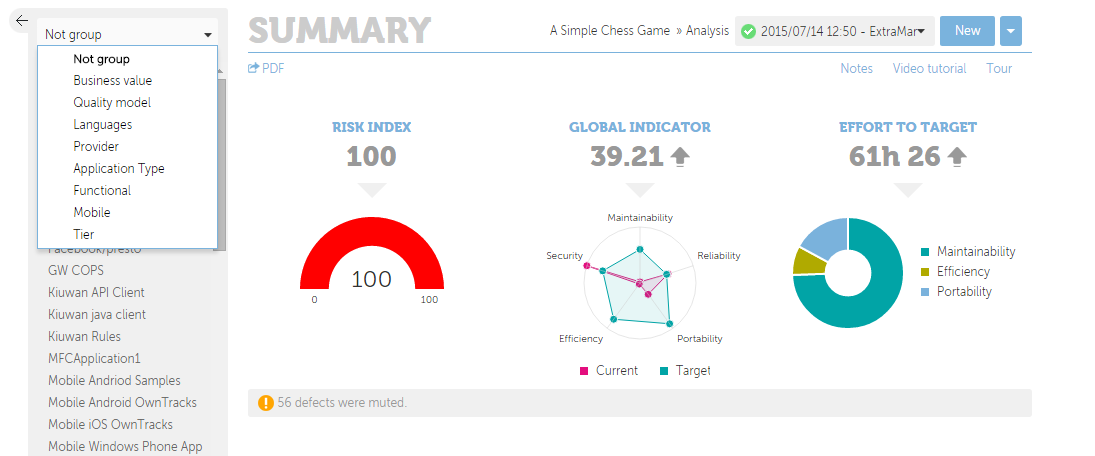
Where the left panel displays the applications tree, and the results on the right will match with the selected group of portfolios or single portfolio selected in the left pane. By applying some filter, you are filtering your applications by the selected filter, as well as by the group of applications first chosen in the left pane. The right side of the page will show:
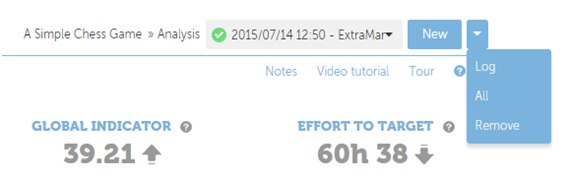
- The analysis selected (whose results are displayed below), a button to run a New analysis on that application and another button to run some actions on the selected analysis:
- Risk associated with the structural quality of the code.
- Global indicator.
- Effort needed to target the quality objectives for the application —Effort to Target—.
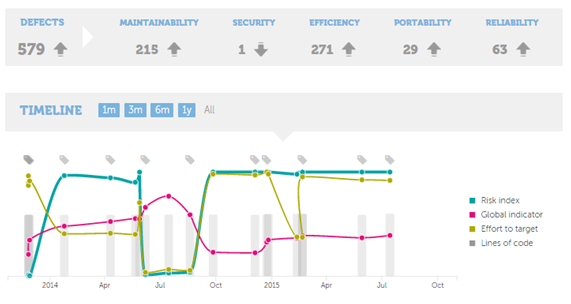
- Essential code metrics.
- The bottom panel shows the timeline of the first three indicators, with the ability to select the scale at 1, 3, 6 or 12 months, or zoom to show all application analysis.
And additional information about that analysis: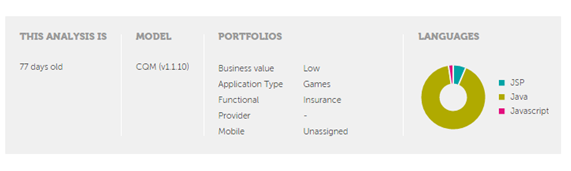
Application report
In PDF format, containing the following information:
- Introduction: methodology.
- Application & analysis information.
- Risk index.
- Quality.
- Reparation efforts.
- Main metric values.
- Metric distribution in files.
- Ten top repair first defects.