Kiuwan solutions perform a static analysis of source code to gather evidence. Based on this evidence
A guide to the security and quality indicators in the Kiuwan Solutions
| Info | ||||
|---|---|---|---|---|
Contents:
|
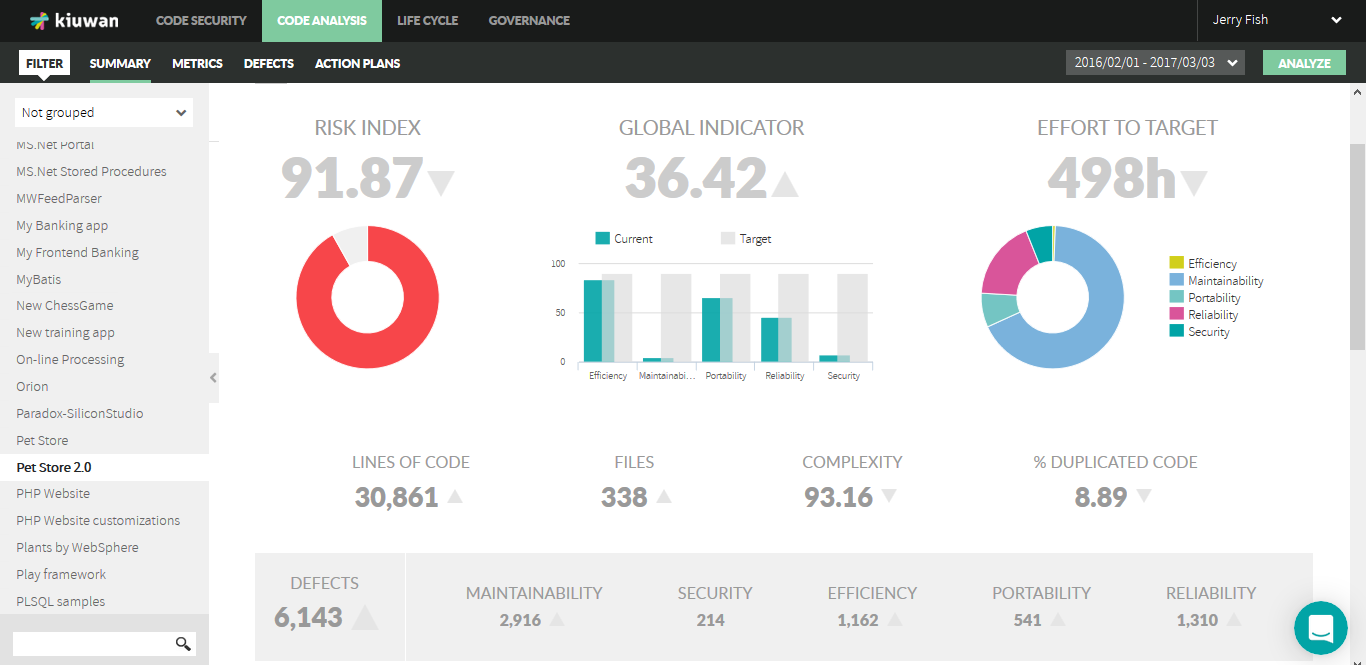
Kiuwan Indicators
Security and Quality Indicators in Kiuwan: a practical guide
Kiuwan gathers evidence from application’s source code using in-house develop Kiuwan static analyzers.
Based on the found evidence from static analysis, Kiuwan calculates and presents relevant Software Analytics Indicators that provide accurate information onsoftware analytics indicators that describe:
- Software characteristics (ISO-25000 based), such as: Security, Efficiency, Maintainability, Reliability and Portability.
- Security
- Efficiency
- Maintainability
- Reliability
- Portability
- A global indicator; Global Indicator, a general index that is calculated as a weighted average of the above software characteristics.
- Risk The risk associated with the structural security and quality of the software.
- Effort The effort to target, or ; the amount of manpower needed to achieve the defined security and quality targets.
- The security rating; Security Rating, a 5-star grade that indicates how secure your applications are.

Kiuwan provides these indicators to help different stakeholders in the SDLC to make informed decisions and manage all kinds of aspects of the development process, with the common goal of continuously improve improving the software and processes.
So, let’s go through them in some detail.
I will follow a bottom-up approach so I would suggest you to keep the reading in order because every concept is based on the previous ones.
Software characteristics
Kiuwan uses CQM as the methodology ((Checking Quality Model) as a ISO-25000 based ) for evaluating methodology to evaluate the software characteristics of a software product.
In order to correlate with software characteristics, CQM provides the next following indicators based on the evidence found using through the static code analysis:
- Security.
The capability of the software product to protect information and data so that unauthorized people or systems cannot read or modify them and . And, at the same time, to ensure that authorized people or systems are not denied access to them. - Reliability.
The capability of the software product to maintain a specified level of estabilitystability. - Efficiency
Efficiency. The capability of the software product to provide appropriate performance relative to available resourceresources. - Maintainability.
The capability of the software product to be modified. Modifications may include corrections, improvements or software adaptability of the software to changes in the environment and in the requirements and functional specifications. - Portability.
The capability of the software product to be transferred from one environment to another.
The normalization of the indicators

Kiuwan’s CQM indicators are normalized. What does this mean?
Indicators’ NormalizationNormalization allows the comparison of different applications between them, based on the characteristics, regardless of the technologies used to implement them.
This means that you can inspect and compare, for example:
- If the software is more maintainable than it is efficient or reliable,.
- Different version of the same application over time (because the meaning of the indicator does not change),.
- Compare two different applications, regardless of the technology.
This normalization allows Kiuwan to represent three different regions you can use to assess your software, make decisions and take appropriate actions:
- 0-30 region. The characteristic pointed to by the indicator is in the RED zone. Improvements are needed.
- 30-70 region. Represented in YELLOW, it means that you have to keep your mind on this indicator. Your next moves will depend on your requirements.
- 70-100 region. The GREEN zone. This is the zone where all indicators must be. No critical defects found.

The Global Indicator (GI)
Now that you understand the specific software characteristic indicators, you probably miss a general indicator. Here comes the Global Indicator.
The Kiuwan Global Indicator (GI) is calculated as a weighted average of the above software characteristics, providing an accurate global metric for the whole application.
The GI is calculated through a complex algorithm that takes into account the severity of the defects, the weight of the category, the analyzed code volume and the criticality of the different programming languages.

Global Indicator Customization
Kiuwan allows you to “customize” this algorithm, by modifying its level of demand, the weights of the category, the weight of the programming languages, the level of importance for every defect priority, the repair difficulty, the priority of the rules, etc…customize this algorithm.
You can set, for example:
- The importance Importance of the characteristics
o You can decide that, for certain applications, maintainability is more important than efficiency but less than security. - Importance The importance of the programming languages
o Depending on your application portfolio, you might decide that in some cases Java defects will be more important than JavaScript ones, but the opposite in other cases. - Importance The importance (priority) of every defect
o From Very High to Very Low, you can decide how important a defect is and consequently how much it will influence each indicator value. - Repair The repair difficulty
o You can fine tune remediation efforts for every single defect or group of defects.
| Info |
|---|
Please |
note that this customization does not necessarily apply to all |
analyses. You can create different customizations for different applications and purposes. Please have a look at |
Guide for further |
information. |
Too many configuration options? Do not get overwhelmed! Kiuwan provides an off-the-shelf model called CQM, with a default calibration of all the above parameters so you can use it immediately. It is a great starting point to start measuring your applications. You can later customize your own model depending on your needs.
QA: Why does the Global Indicator show a lower value if I have reduced the number of defects?
As you probably have already guessed, most of the time, that reduction is because the new analysis introduced higher priority defects than the previous one. Those new defects do have a higher associated penalty and, consequently, the Global Indicator decreases.
Effort to Target (E2T)
CQM provides some default “targets” for the different software characteristics. Targets are considered as desirable values for indicators and are defined at application level.
Comparing the actual indicator value to the target, you will see at a glance how far you are from the desired values. Obviously, you can fine tune these default values (set to 90 by default).
Every defect found by Kiuwan has an associated priority and an effort to programmatically remediate it. Effort is measured in man/hours.
Taking into account the found defects, their priority, remediation effort and targets, Kiuwan calculates the total effort needed to repair the defects and reach the target for every characteristic. The result of this calculation is presented as the Effort to Target indicator (E2T). You think Think of the E2T as the technical debt you have accumulated in your application due to code problems affecting the different characteristics.

QA: Does Effort to Target indicator mean the effort to correct all the defects?
No. A very common confusion on Effort to Target is to understand it as the effort to remediate ALL the found defects. This is not so, the indicator represents the effort needed to reach the defined targets. If you want to see the total effort, you have it available in the metrics screen for every application.
Risk Index (RI)
Kiuwan’s Risk Index (RI) is a summary indicator that concentrates all the above indicators to provide a measure of the implicit risk associated to the security and quality aspects of your application, according to your defined requirements (targets)..
Kiuwan Risk Index The RI provides a measure on measurement of how far you are to get to an acceptable security and quality level. Remember that the exact meaning of “acceptable” acceptable is defined by you (the “target”target).

The Risk Index calculation concentrates all the evidence found in the source code of your application, combining Global Indicator (GI), Effort to Target (E2T) and Application Size.
Take into account that every indicator is represented by a different mathematical distribution (Gaussian, Lineal, and Step, respectively), so its interpretation should be made carefully because of the interaction among them.
Security Rating
Kiuwan’s Security Rating has been introduced to bring to the surface the application security details. It provides a 5-star rating that indicates how secure your application is in terms of the likelihood and impact of the found security vulnerabilities.
The security vulnerabilities found by Kiuwan are grouped in a quadrant according to two major axes:
- The impact of the vulnerability, according to the severity of the associated security risk.
- The likelihood of the event that could cause the associated security breach.
These two axis produce 4 quadrants. Kiuwan summarizes the found vulnerabilities for each quadrant.

Kiuwan’s Security Rating is quite strict. It will assign additional stars as the related quadrants become empty of vulnerabilities.
- Security Rating starts from 1-star (i.e. 0 is not considered) when there is at least 1 Very-High vulnerability (high impact, high likelihood)
- 2-star rating when there is at least 1 High vulnerability (high impact, low likelihood) and none of higher priority.
- 3-star and up will follow this schema.
Applications with 5 stars are considered to be secure, whereas those with 1 star are considered to be very insecure.
Please visit Security Summary for more information.
Common Questions and Answers
Why does the Global Indicator show a lower value if I have reduced the number of defects?
As you probably have already guessed, most of the time, the Global Indicator is reduced because the new analysis introduced higher priority defects than the previous one. Those new defects do have a higher associated penalty and, consequently, the Global Indicator decreases.
Does the Effort to Target indicator mean the effort to correct all the defects?
No. A very common confusion on Effort to Target is to understand it as the effort to remediate all the found defects. This is not so, the indicator represents the effort needed to reach the defined targets. If you want to see the total effort, you have it available in the metrics screen for every application.
How should the Risk Index be interpreted?
Although the Risk Index scale is 0-100, any value greater than 0 should be observed. Nevertheless, what is The most interesting is thing to monitor is its evolution over time, as it indicates the evolution of your application exposure.
Pay attention to the risk index evolution over time.For example, if you have a low
| Global Indicator |
|---|
| Effort | Risk | |
|---|---|---|
| low | low | low |
| low | high | high |
If I spend 20% of the total Effort to remediate defects, should I expect a proportional reduction (20%) in the Risk Index?
As said above, it will depend on the application size and how far you are from the target.:If your application is small and you have a high effort to target, that probably means that it’s not
| Size of application | Effort to target | Consequence |
|---|---|---|
| small | high | Not worth it to spend |
| the effort to correct it |
But if the application size is high, any reduction in risk will be more sensitive to remediation effort, and you will see how the risk index is reduced as you remediate problems.
Questions on this matter can be many. My intention in this post is to provide a quick understanding on the rationale being applied to the calculation of Risk Index.
I can see you are thinking… Oops, this is not easy. Keep on reading…
| . Better to rebuild from scratch | ||
| high | high | Remediation efforts will strongly effect the risk involved. |
How can I know what actions to do once I get the results of the Kiuwan indicators?
To facilitate this decision-making process, Kiuwan provides a “whatWhat-if simulator”, that simulator. This simulator will predict how your indicators will change depending on the remediation effort you can spend or the values you want to achieve for the different characteristics characteristic indicators in your next development iteration. The simulation will generate as well a comprehensive action plan with the defects you have to work on to get the predicted results.
More information about Action Plans and Simulation (whatWhat-if) at https://www.kiuwan.com/docs/display/K5/Action+Plans and https://www.kiuwan.com/docs/display/K5/New+automatic+action+plan.+What+if+analysis

Security Rating
Kiuwan’s Security Rating has been recently introduced.
The reasoning behind it is to surface the application security details by providing a 5-star grade that indicates how secure your application is in terms of the likelihood and impact of found security vulnerabilities.
Security vulnerabilities found by Kiuwan are grouped in a quadrant according to two major axes:
- Impact of the vulnerability, according to the severity of the associated security risk
- Likelihood of the event that could cause the associated security breach
These two axis produce 4 quadrants. Kiuwan summarizes found vulnerabilities for each quadrant.
Kiuwan’s Security Rating is quite strict. It will assign additional stars as related quadrants become “empty” of vulnerabilities.
- Security Rating starts from 1-star (i.e. 0 is not considered) when there is at least 1 Very-High vulnerability (high impact, high likelihood)
- 2-star rating when there is at least 1 High vulnerability (high impact, low likelihood) and none of higher priority
- 3-star and next will follow this schema.
Applications with 5 stars are considered to be secure, whereas those with 1 star are considered to be very insecure.
Please visit https://www.kiuwan.com/docs/display/K5/Security+Summary for more information.
At this time, those of you that are reading this post might be thinking..
under Action Plans in Code Analysis and New automatic action plan. What if analysis.
How does the Security Rating relate to the above-mentioned Security Indicator?
Although both indicators measure security, they each indicator measures measure a different aspect of security.While
- The Security Rating provides a rating based on detection
- of security
- holes (or breaches)
- The Security Indicator provides a measure
- of level of protection
Let’s imagine we have 3 buildings with the following indicators:
1. A single family house (sec rating:1, sec indicator: 20)
2. A block of apartments (sec rating:1, sec indicator: 50)
3. A military building (sec rating:1, sec indicator: 70)
Each of them has one high-priority vulnerability (e.g. an open window). Therefore, all of them will have a 1-star Security Rating (they are completely vulnerable).
But then we find that the Security Indicators are different for each of them. How then can these results be understood?
Although all of them are highly vulnerable because of the high priority vulnerability, the different Security Indicators show the different levels of protection mechanisms each of them have.
Building #1 presents a low level of overall protection, #2 a medium level and #3 a high level, based on the quantity and quality of protection mechanisms they have.
The higher the security indicator, the more the protection mechanisms are present and validated by Kiuwan. The lower the security indicator, the more security checks have failed during the analysis.
In the above example, the military building has a high security rating (.
Each building has the same vulnerability: an open window.
| Type of building | Security Rating | Security Indicator | |
|---|---|---|---|
| A single family house | 1 | 20 | If you solve one vulnerability (close the window), there are still many other vulnerabilities open. The rating won't change unless you solve many more vulnerabilities. |
| A block of apartments | 1 | 50 | |
| A military building | 1 | 70 | It has a high security rating, because most of the security checks are ok |
. But there is one vulnerability that drops down the |
Security Rating. Once that |
is resolved, |
both the rating and the indicators will improve. |
Moreover, size matters!
The security indicator is also considering the density of security mechanisms and breaches according to the size of the building. It’s not the same to have one window open in a family house with 10 windows, than or in a block of apartments with 100 windows. This explains why, even with the same vulnerability, the Security Rating is low in both cases bit , but the Security Indicator is higher in the block of apartments.Thank you for reading and stay tuned for more.