...
Insights >> Security
...
...
...
Information on components’ Security is accessible through Insights >> Security tab.
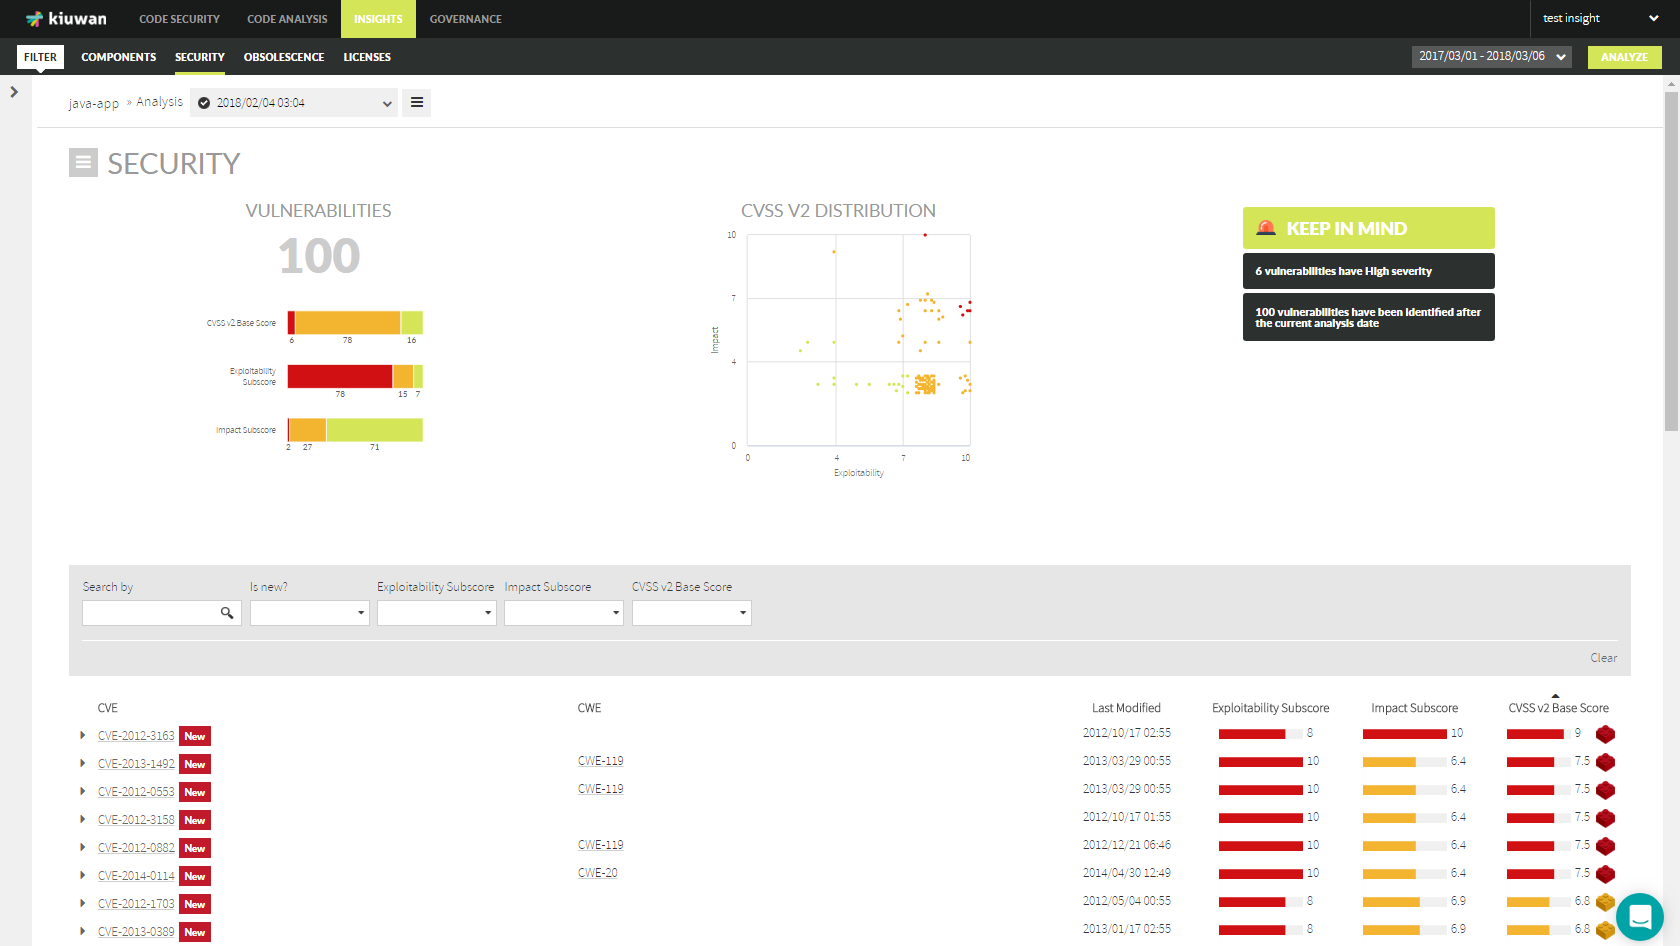
Security Risk
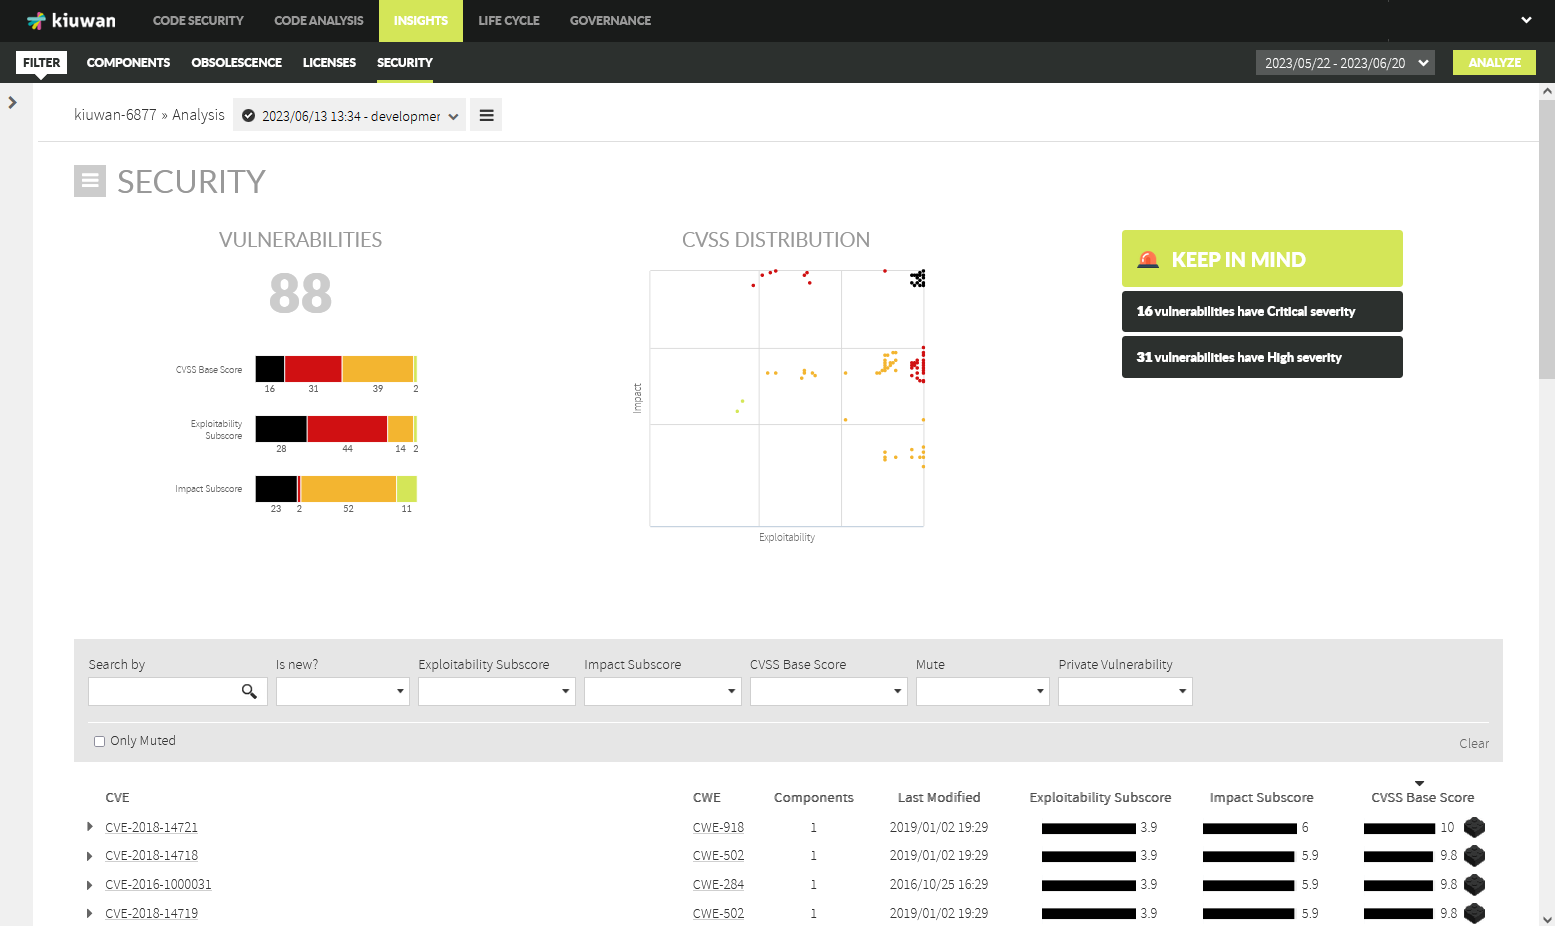
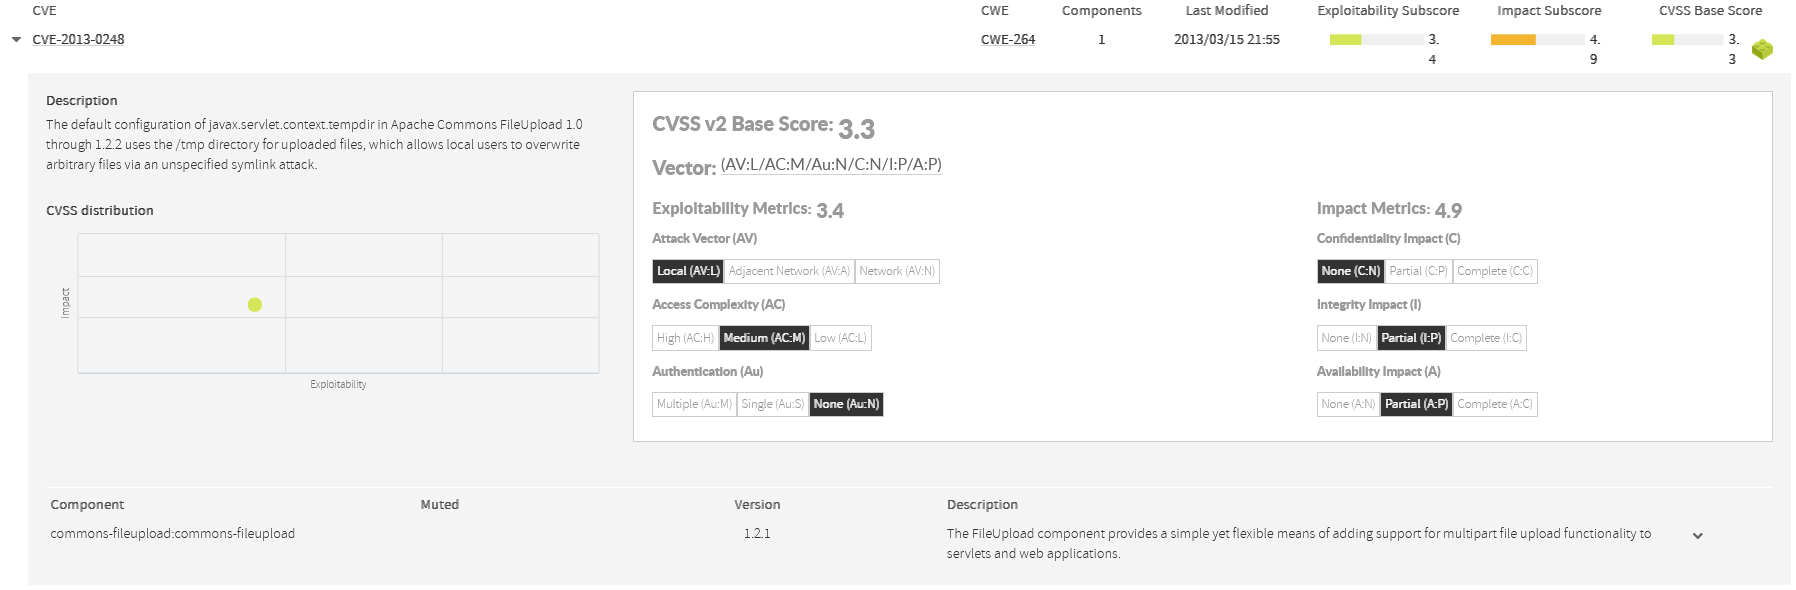
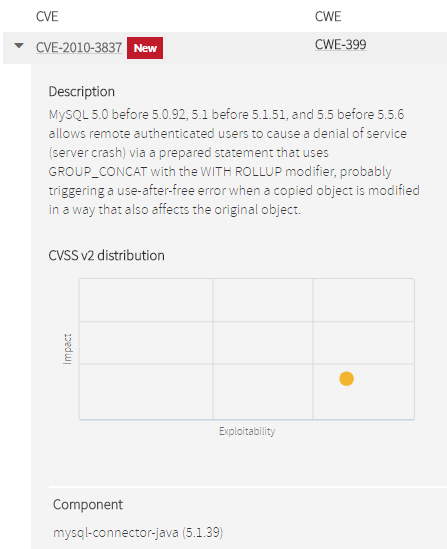
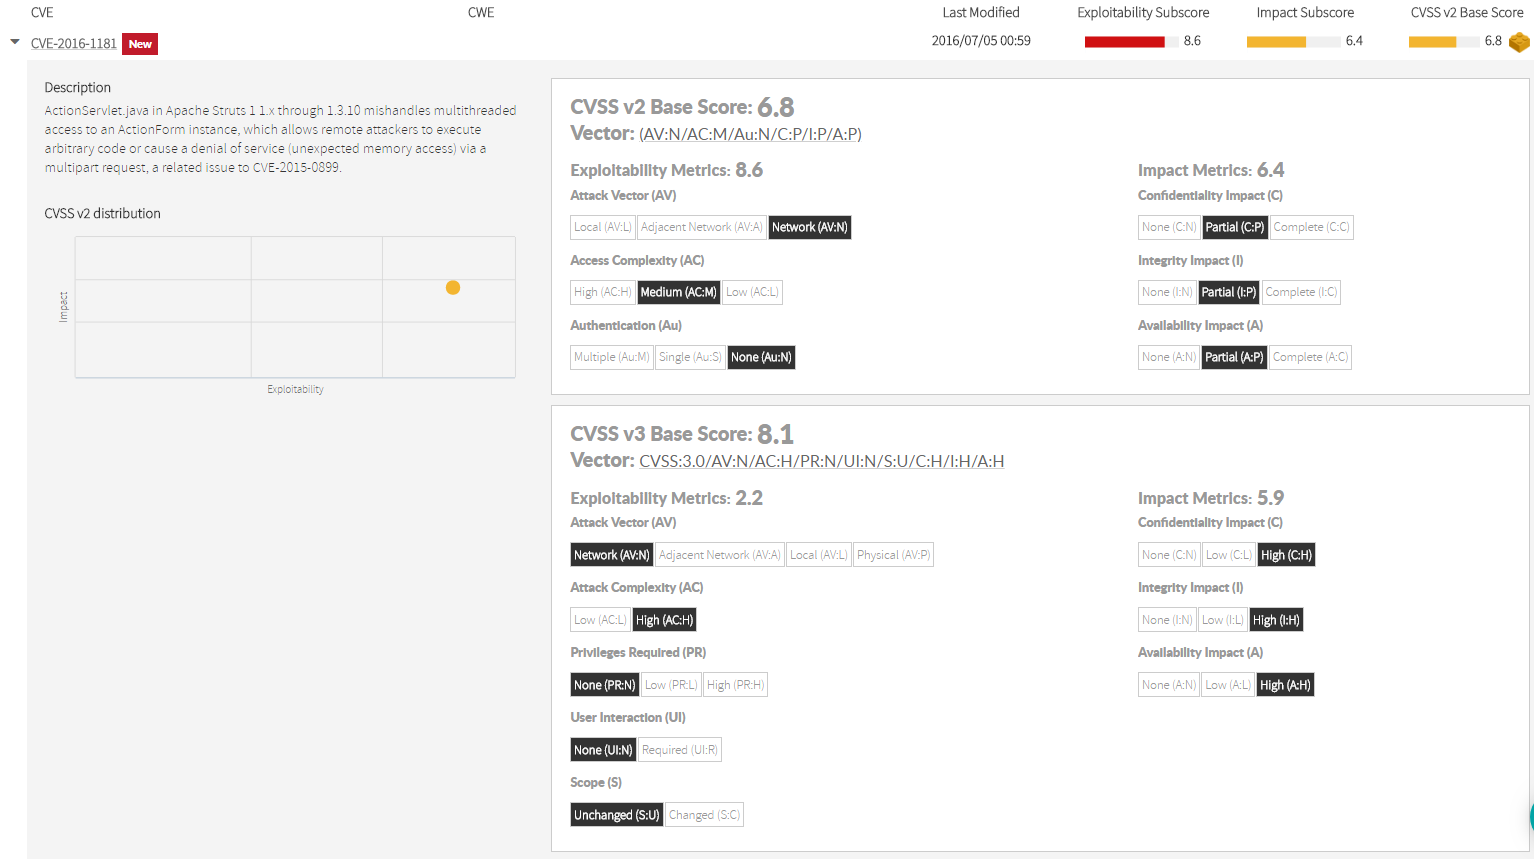
The main screen of the Security tab shows first-hand information on the Vulnerabilities, the CVSS Distribution chart, and a summary of the number of vulnerabilities with Critical and High severity. In addition, you can find the list of all the analysis vulnerabilities. To find a CVE, you can refine your search by using the filter based on the search criteria described below:

- Search by: Type any reference of search.
- Is New?: Select Yes if the vulnerability is new; otherwise, select No.
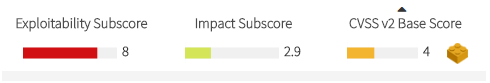
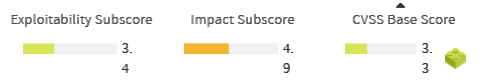
- Exploitability Subscore: Depending on the severity of the exploitability subscore, select Critical, High, Medium, Low, or None.
- Impact Subscore: Select Critical, High, Medium, Low, or None depending on the severity of the impact subscore.
- CVSS Base Score: Based on your search preference, select Critical, High, Medium, Low, or None.
- Mute: Refine your search to the muted components by selecting Global, Application, Global/Application, or None.
- Private Vulnerability: Filter your search by private vulnerabilities.
Security Risk
With Kiuwan Insights you can easily detect those components that have well-known security vulnerabilities.
...
...
...
...
This list is continuously growing.
...
...
...
...
...

| Info | ||
|---|---|---|
| ||
A component’s Security Risk is based |
...
For example, let’s suppose your app is using Struts TagLib 1.3.8. Kiuwan will display next information:
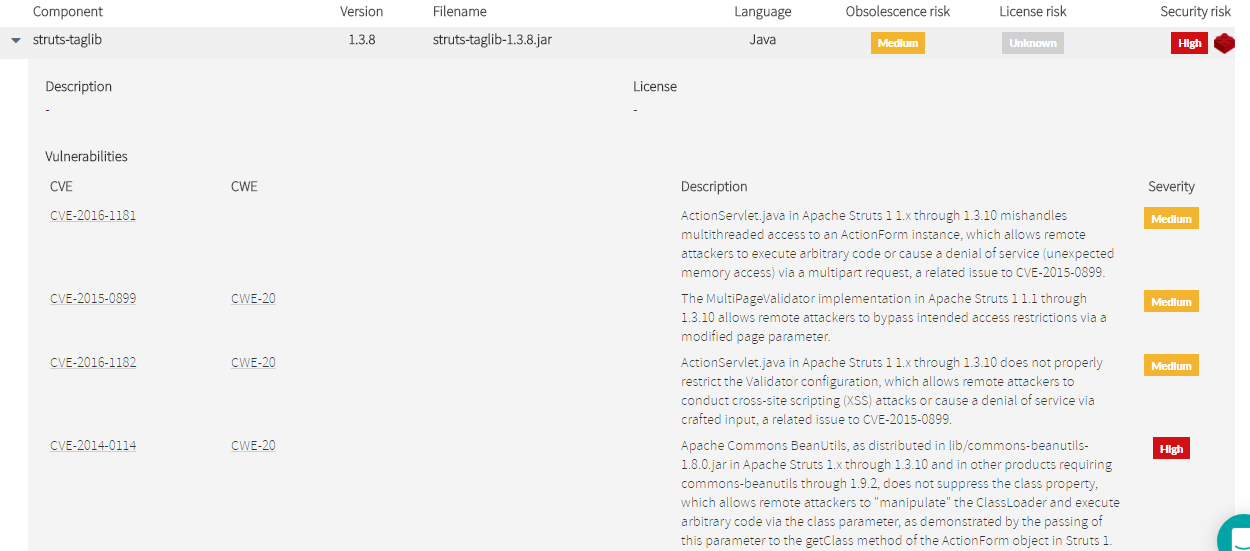
Struts TagLib 1.3.8 has 4 known vulnerabilities, three are considered as Medium and one as High. Therefore, Kiuwan will mark Struts TagLib 1.3.8 as High.
...
represented with the following labels:
![]()
![]()
![]()
![]()
![]()
CVSS
Kiuwan Insights supports the calculation of the vulnerability security score for the components using NIST Common Vulnerability Scoring System (CVSS). The CVSS method is used to provide a value of severity.
Kiuwan calculates the CVE’s scores using CVSS v3, and using CVSS v2 only when v3 is not available. Below you can find more information on the two versions:
| Anchor | ||||
|---|---|---|---|---|
|
...
Security Risk Indicator
...
Value
...
Label
...
0
...
( 0 , 4 ]
...
( 4 , 7 ]
...
( 7, 10 ]
...
...
...
...
...
...
...
CVSS v2 Base Score
The Base Score
...
...
...
...
...
...
...
...
The
...
...
...
worse” ).
CVSS v2 Scores | |
Value | Label |
[ 0, 4 ] |  |
...
[ 4, 7 ] |  |
...
[ 7, 10 ] |  |
...
| Info |
|---|
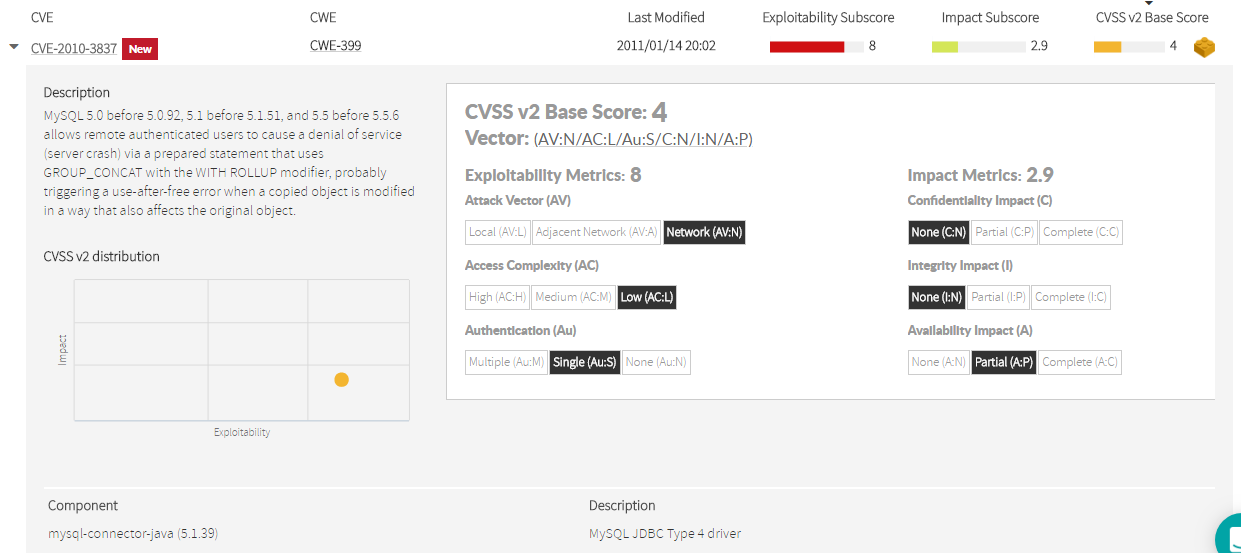
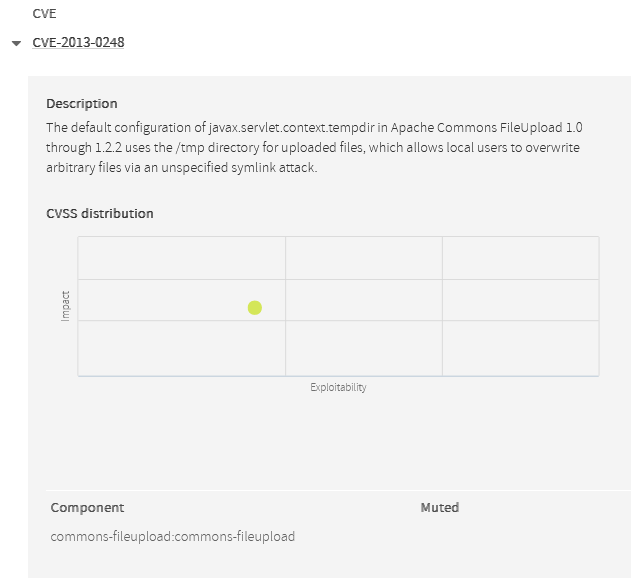
Kiuwan Insights provides a 2-axis figure that can help you to easily understand these two important characteristics of the vulnerability.
|
...
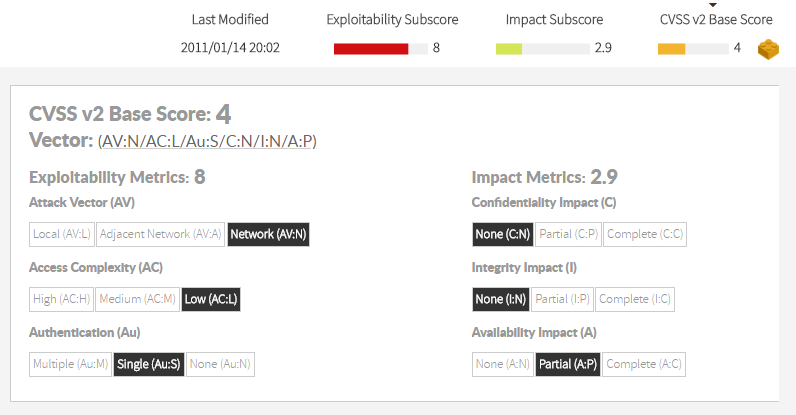
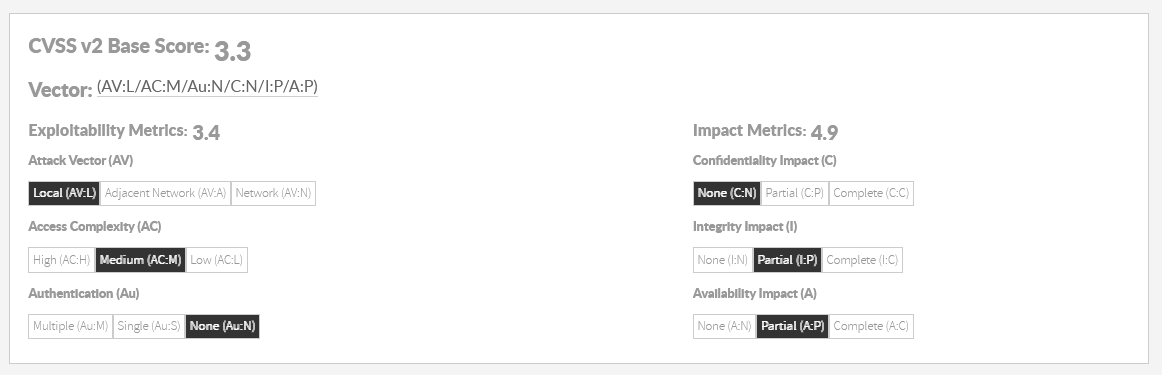
Kiuwan Insights displays the value for every subcore’s metric.
...
...
...
Let’s understand the meaning of every metric.
...
...
...
...
...
...
...
...
...
...
...
...
...
However, not all vulnerabilities reported to NIST‘s National Vulnerability Database (NVD) have been scored according to v3 guidelines. Indeed, only a subset of them has been re-scored.
| Info |
|---|
Because of this, although Kiuwan Insights displays v3 data (when available), only v2 data will be used when computing components’ Security Risk indicator. |
New vulnerabilities
CVSS v3 Base Score
The Base Score for CVSS v3 is presented as a number ranging from 0 to 10, with an associated color based on its importance ( “the higher, the worse” ).
CVSS v3 Scores | |
Value | Label |
[ 0, 4 ] |
|
[ 4, 7 ] |
|
[ 7, 9 ] |
|
[ 9, 10 ] |
|
Kiuwan Insights displays the value for every subscore’s metric. Let’s examine the meaning of every metric.
Exploitability metrics
- Attack Vector (AV): This metric reflects the level of proximity the attacker needs to obtain to the system to exploit the vulnerability. The more remote an attacker can exploit the vulnerability, the more vulnerable the system is.
- Values: Network - Adjacent Network - Local - Physical ( N / A / L / P )
- Attack Complexity (AC):This metric delineates the attacker's out-of-control conditions that must exist to exploit the vulnerability. For less complex attacks, the metric value is greater.
- Valued: Low - High ( L / H)
- Privileges Required (PR): This metric presents the attacker’s required privileges in order to exploit the vulnerability successfully. The greater the metric, the fewer privileges are required. For less required privileges, the metric value is greater.
- Values: Low – Low – High ( N / L / H )
- User Interaction (UI): This metric describes how much interaction of the user is needed before the vulnerability can be exploited. The metric value is greater for less required user interaction.
- Values: None - Required ( N / R )
- Scope (S): The computing authority determines a set of privileges when granting access to the resources of a computer. The change of Scope occurs when the vulnerability of a component ruled by one authorization scope affects resources that are ruled by another authorization scope.
- Values: Unchanged - Changed ( U / C )
Impact Metrics
- Confidentiality Impact (C): This metric calculates the degree of confidentiality loss caused by an exploited vulnerability.
- Values: None - Low - High ( N / L / H )
- Integrity Impact (I): This metric calculates the degree of integrity loss caused by an exploited vulnerability.
- Values: None - Low - High ( N / L / H )
- Availability Impact (A): This metric calculates the degree of availability loss caused by an exploited vulnerability.
- Values: None - Low - High ( N / L / H )
Values of the above metrics are combined to calculate CVSS v3 Base Score and Exploitability / Impact Subscores as described at https://nvd.nist.gov/vuln-metrics/cvss/v3-calculator.
CVSS Distribution 2-axis figure
Each listed CVE provides a vulnerability description and the CVSS Distribution 2-axis figure. This figure can help you visualize two main characteristics of the vulnerability.
- The closer to the right a vulnerability is, the easier it will be to exploit it.
- The closer to the top the vulnerability is, the consequences will have a higher impact.
New vulnerabilities
The NIST database is continuously being feed with new vulnerabilities.
...
...
...
...
...
...

...