...
Kiuwan Governance provides an out-of-the-box a predefined PDF report that you generate by selecting PDF option in Summary section.
Although was designed to be broadly used, you would want to create your own report to suite your specific needs
Sometimes, that report does not completely suite your needs. Here comes Kiuwan Report to help you.
...
- A Kiuwan Report is created selecting its visual components from a widgets library.
- Once the report is created, it's generally available to the rest of the users. At any time, you will be able to modify any published report.
- Any user of your account can then “generate” “generate” (or execute) the report selecting a date period. The report will be populated with data within the selected data range.
| Info |
|---|
Only users granted with “report generation” privilege can create a custom report.
Once created, any user can generate the report. |
Reports Creation
| Info |
|---|
A Report is composed of widgets. A widget is a graphical element that displays information. To create a Report, you select the widgets from Kiuwan Widgets Library . |
...
Every selected widget will be presented as a page of the report. At the time of report creation, you decide exactly what information will be included in the widget.
Reports Edition
| Info |
|---|
You create a report by adding widgets from Kiuwan library. |
As you add widgets, you can see an overview of the report’s widgets.
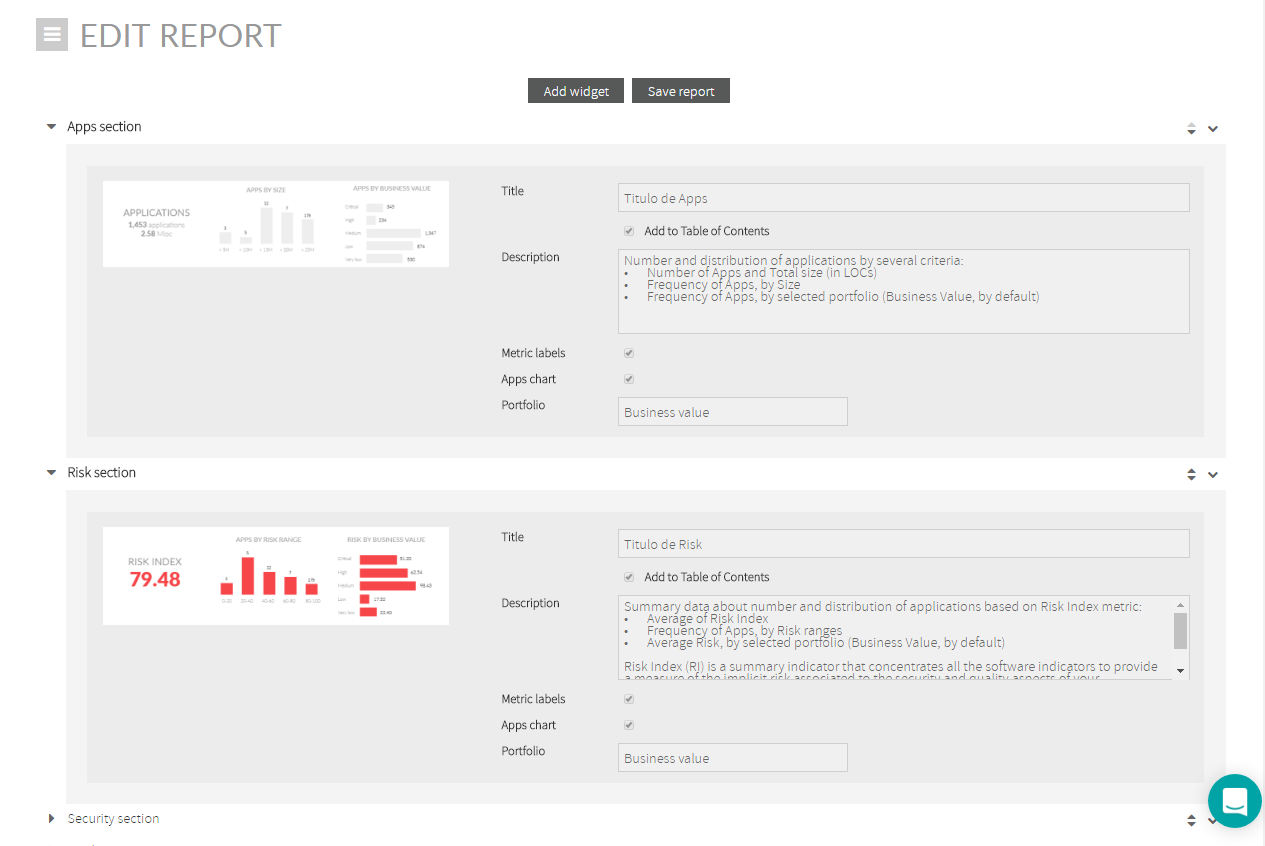
You can re-order the list of report widgets, as well as to edit/delete any of the widgets by accessing the widget menu.
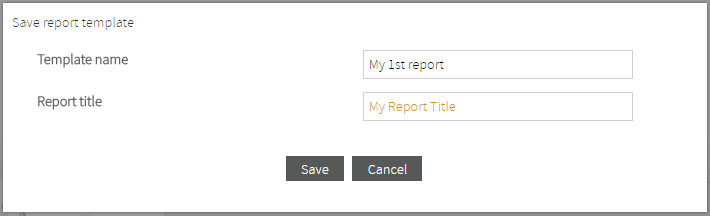
To save your work in the report, you can click on Save button. This will save it and will ask you for report name and title.
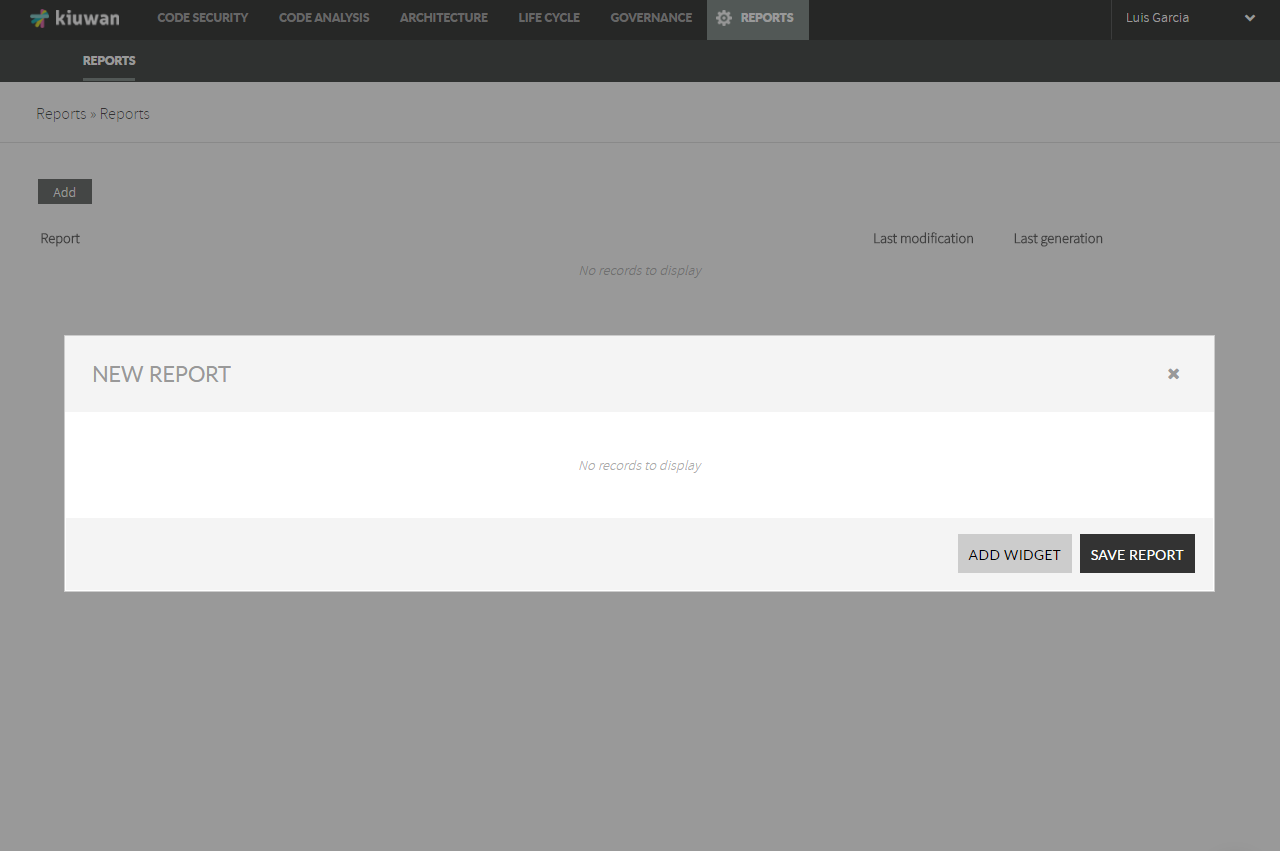
How to create a Report
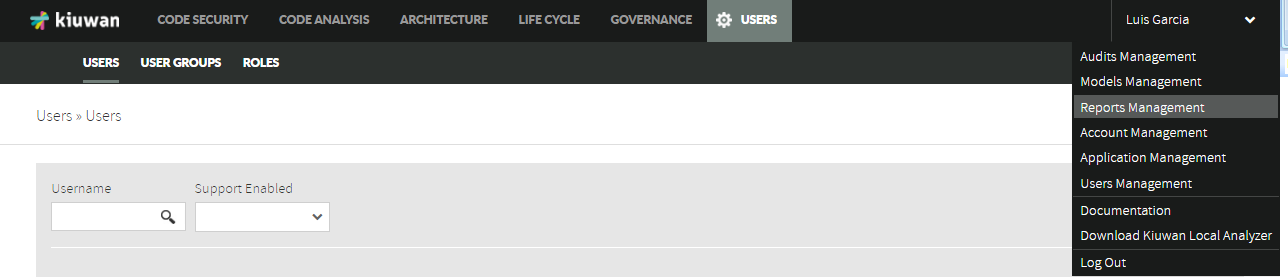
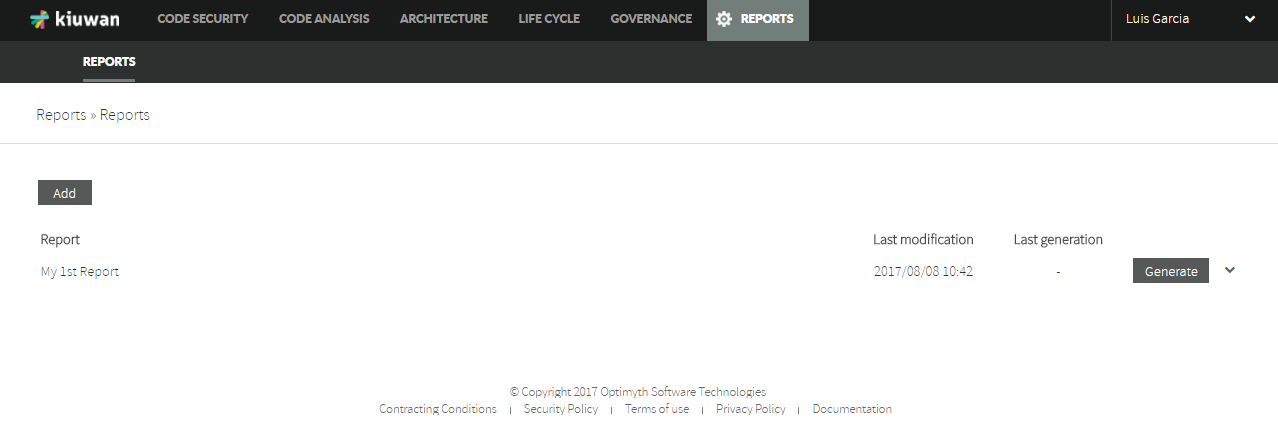
Reports Management option can be accessed from the drop-down menu at the top-right.
Add button lets you create a new report.
| Info |
|---|
You create a report selecting widgets from Kiuwan library. |
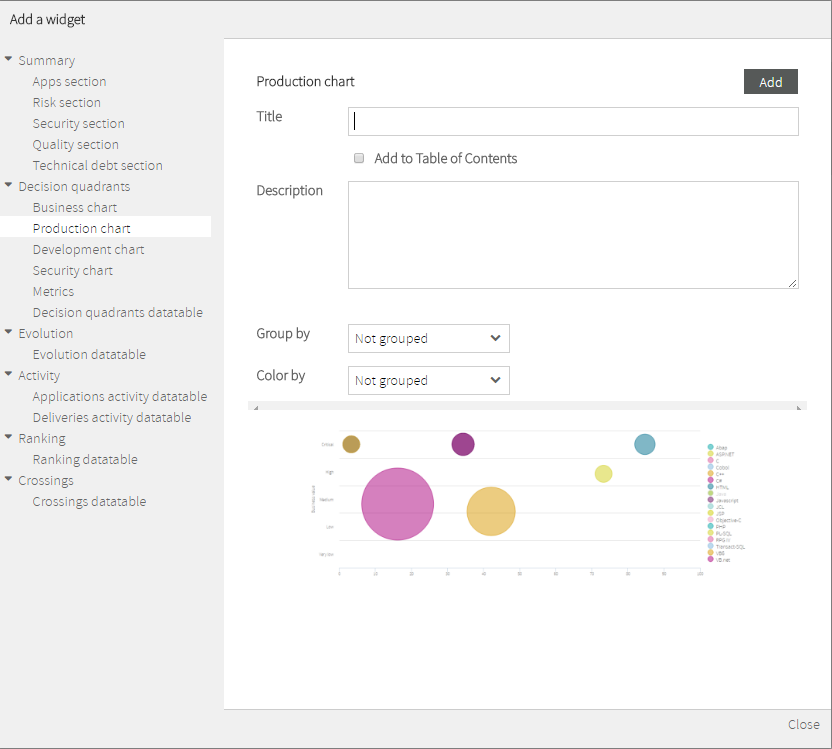
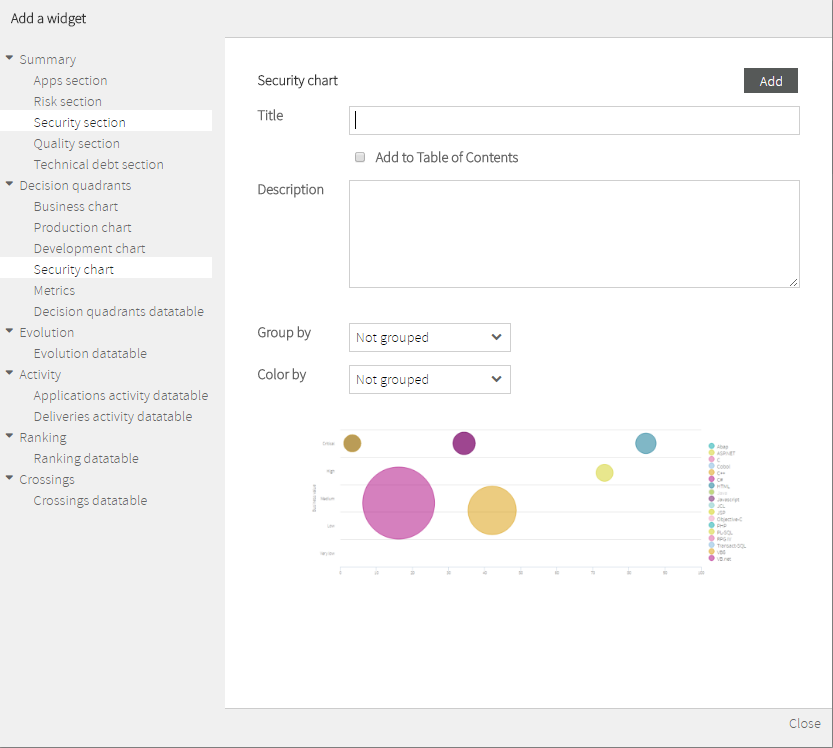
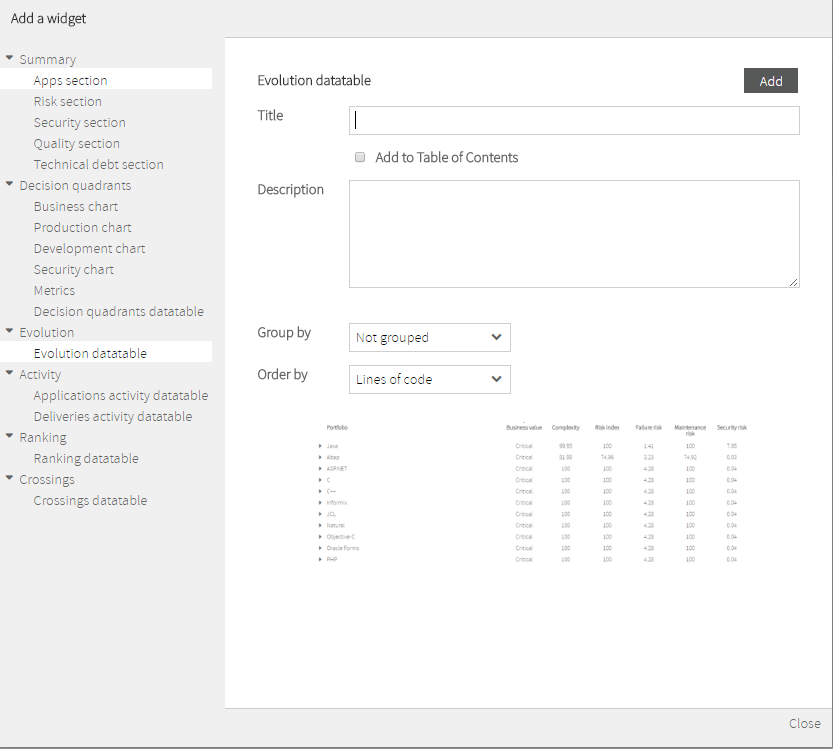
Clicking on "Add Widget" will open a selector of available widgets.
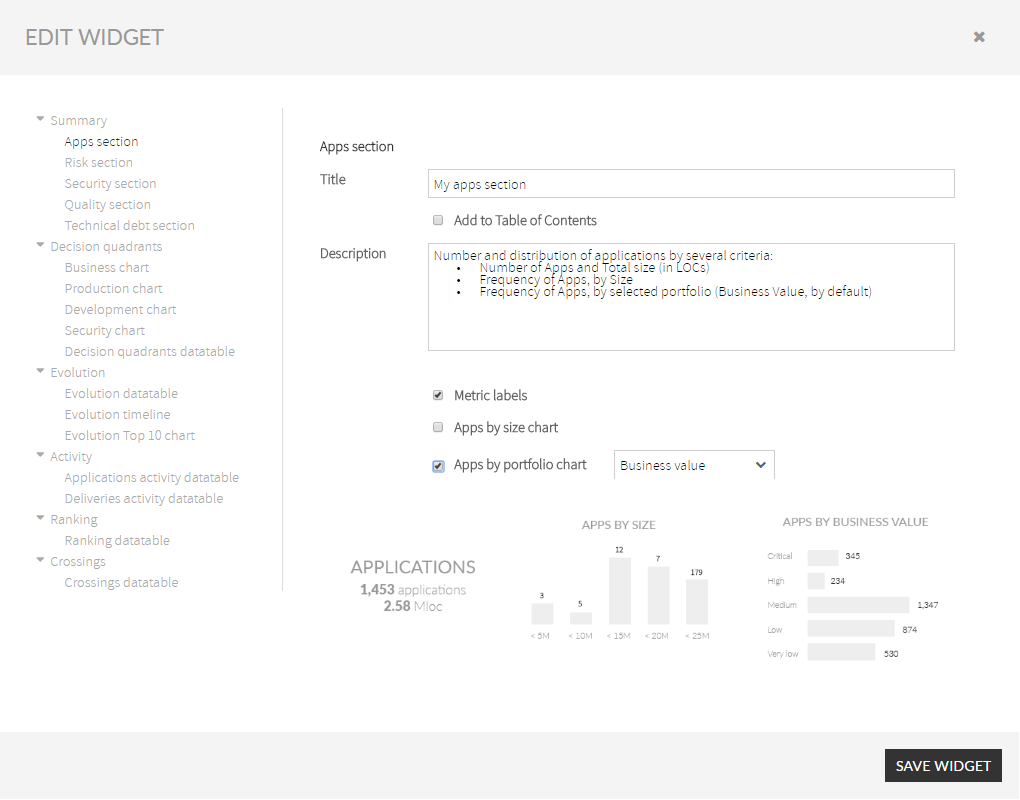
You can select any of the available widgets from the tree selecttor at the left.
After filling its properties, clicking on "Save Widget" will add the widget to the report.
As you add widgets, you can see an overview of the report’s widgets.
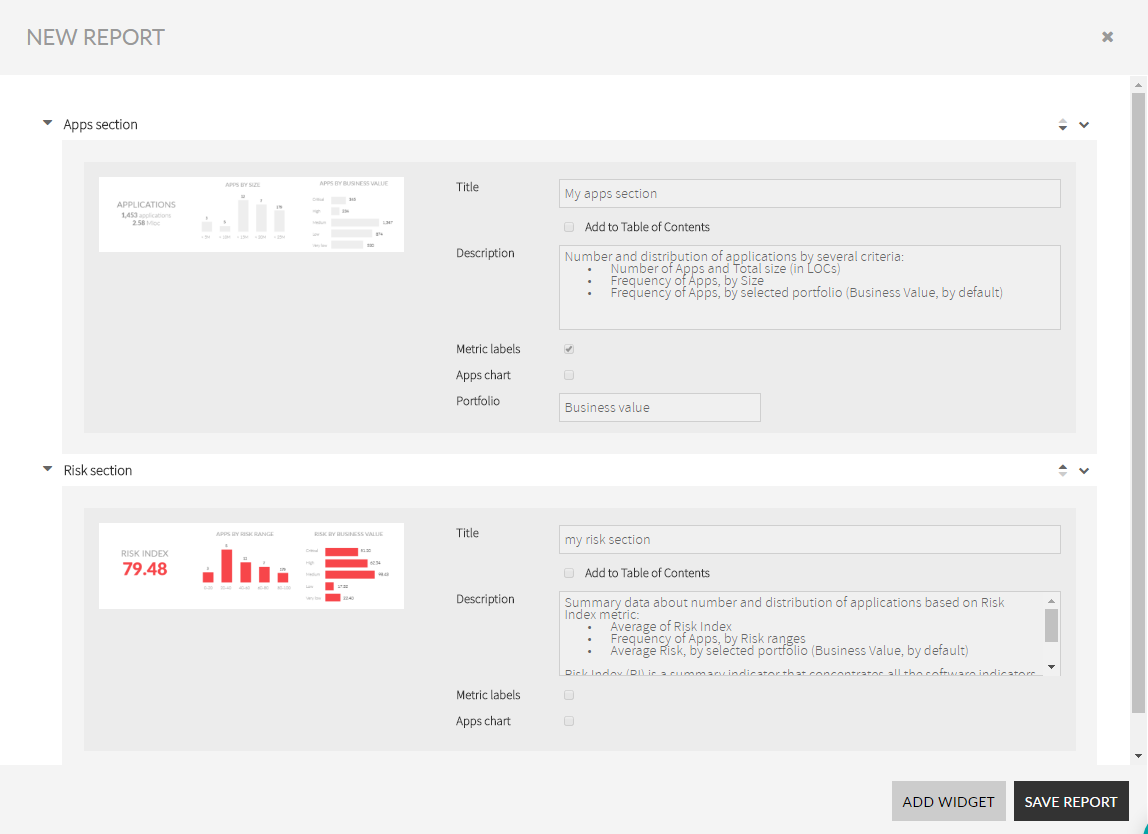
You can re-order the list of report widgets, as well as to edit/delete any of the widgets by accessing the widget menu.
To save your work in the report, you can click on Save Report button. This will save it and will ask you for report name and title.
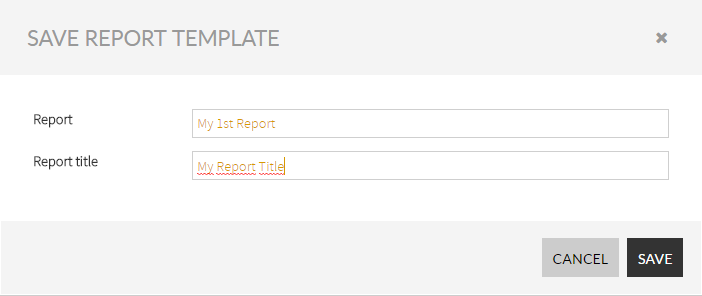
- “Report Name”: an internal name that fully identifies the report to Kiuwan users
- “Report Title”: the title of the report, i.e. the title that will appear at the first page of the generated report (
- “Report Name”: an internal name that fully identifies the report to Kiuwan users
- “Report Title”: the title of the report, i.e. the title that will appear at the first page of the generated report as well as a heading for all the report pages).
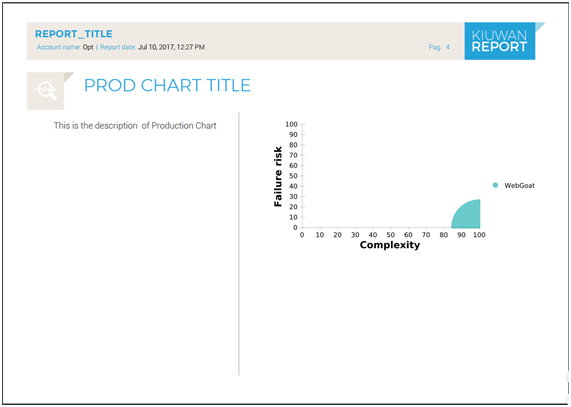
Next image shows an example of a report first page with title “REPORT_TITLE”
...
And next image shows an example of a page heading.

Reports Generation
...
| Info |
|---|
Every created report will be available to Kiuwan users under Reports section |
.
| Info |
|---|
Any user of the Kiuwan account will be able to generate the report selecting it and clicking on Generate option. |
...
When the user selects to generate a report, next dialog is presented.
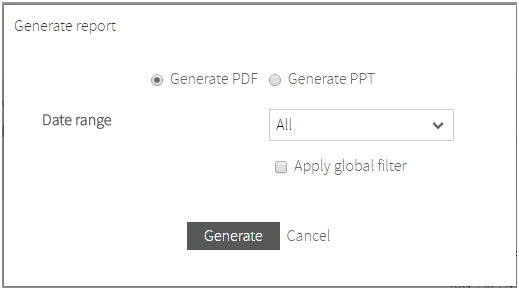
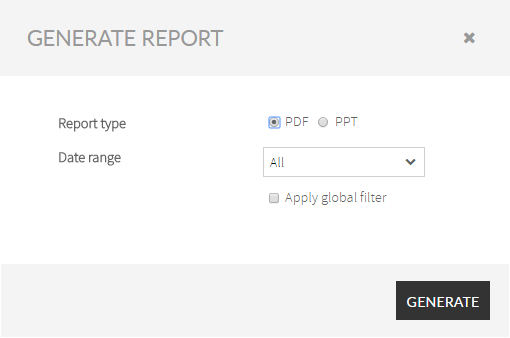
Report FormatType:
You can select between the format of the report (PDF or PowerPoint).
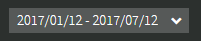
Data Range:
| Info |
|---|
The report will be generated based on available data during the selected time period. |
...
Note: "Apply actual range" will apply dates as set in the Calendar.
Apply Global Filter:
By default, the report will be generated for all the applications within the selected time period.
Nevertheless, you can restrict the data report to any a subset of applications.
If "Apply Global filter" is checked, only applications matching selected filter will be included in the report.
...
You select any of them, configure its specifics properties and Add to the report.
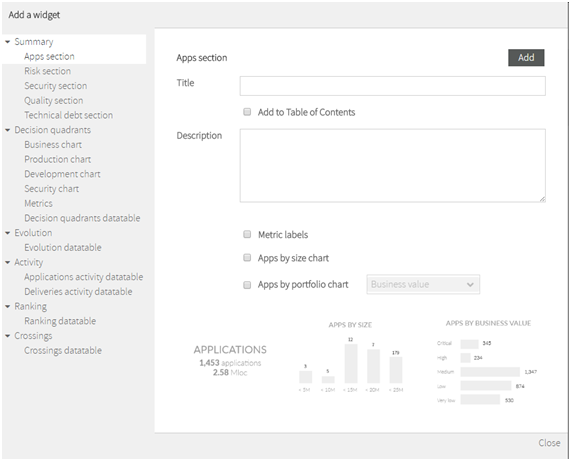
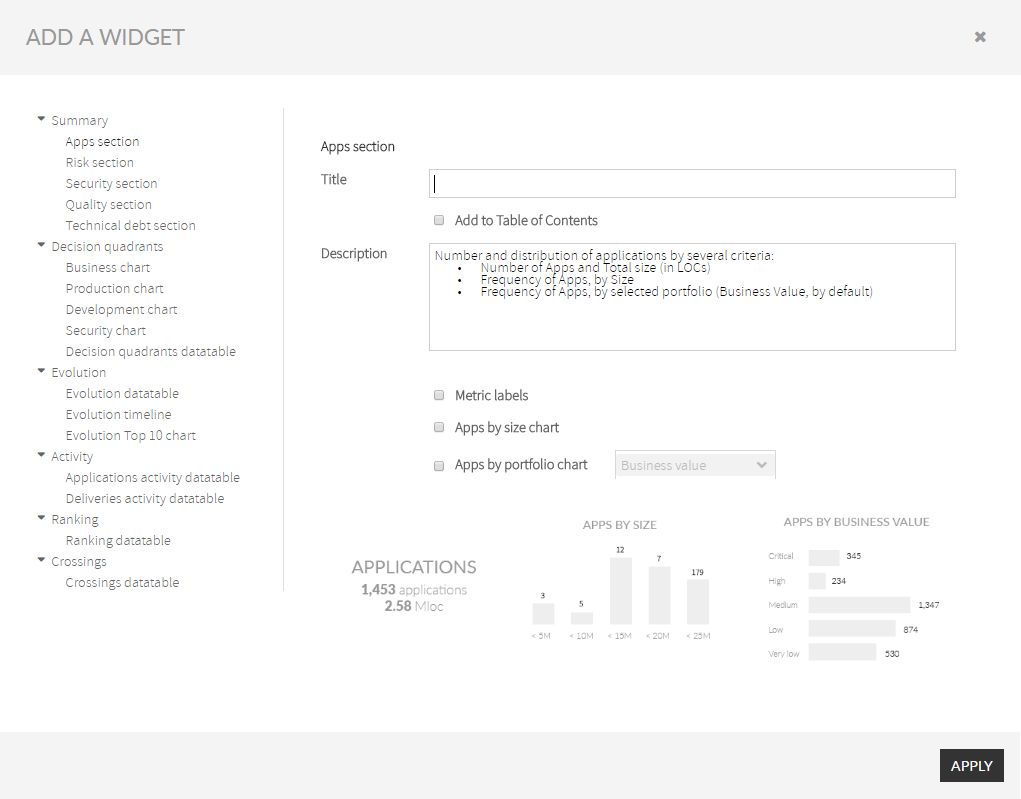
Most of available widget share some common characteristics:
...
- Number of Apps and Total Size (in Millions of LOCs)
- Number of Apps, grouped by Size
- Frequency of Apps, grouped by selected portfolio (Business Value, by default)

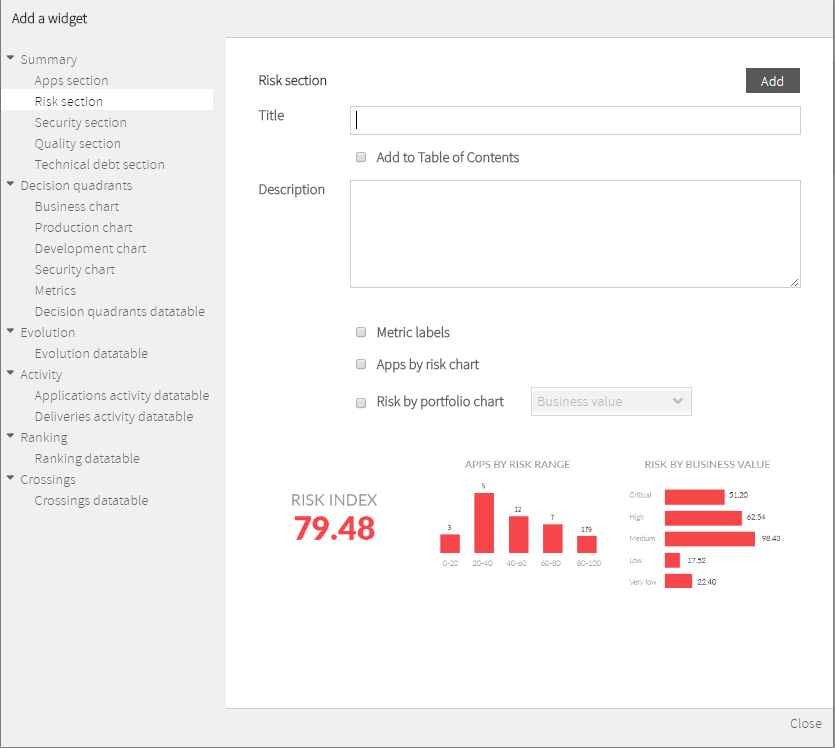
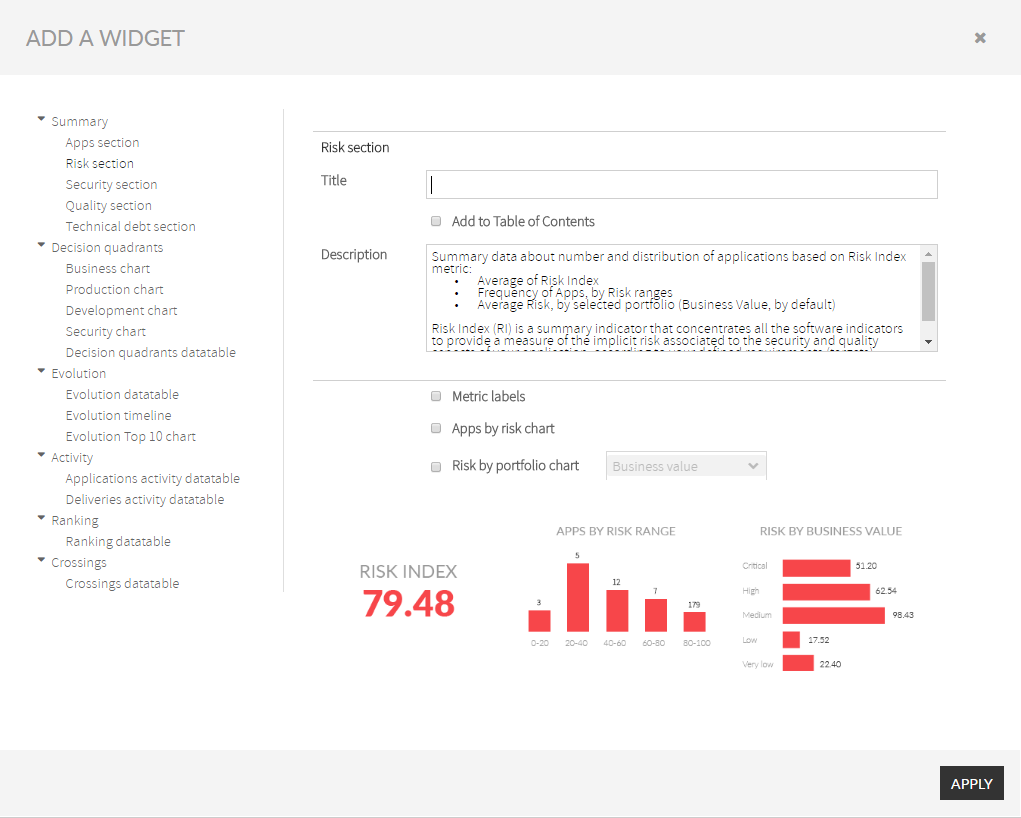
Risk Section
Risk Section widget includes summary data about number and distribution of applications based on Risk Index metric:
- Average of Risk Index
- Number of Apps, grouped by Risk ranges
- Average Risk by selected portfolio values (Business Value, by default)
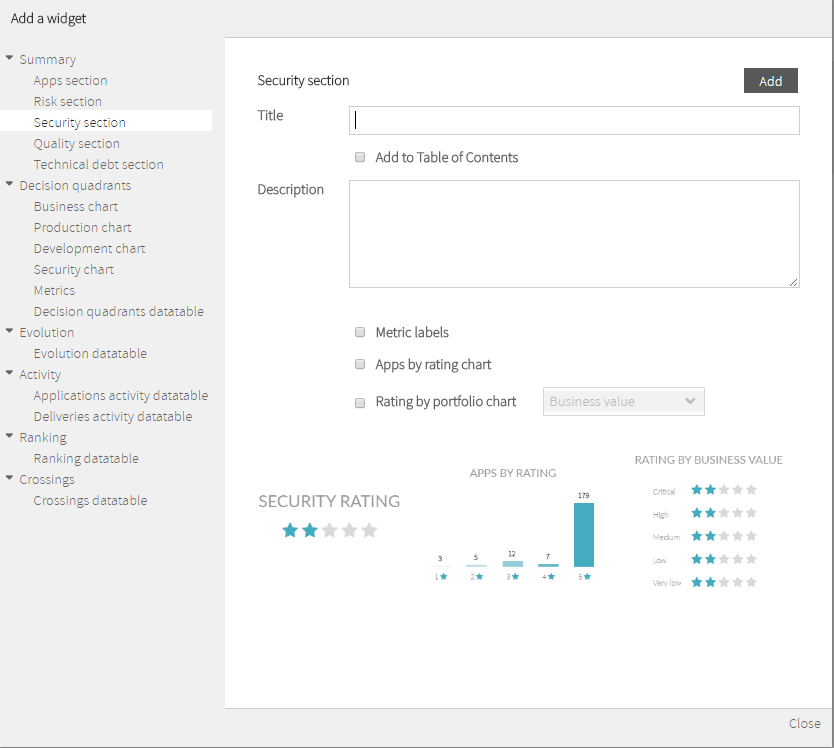
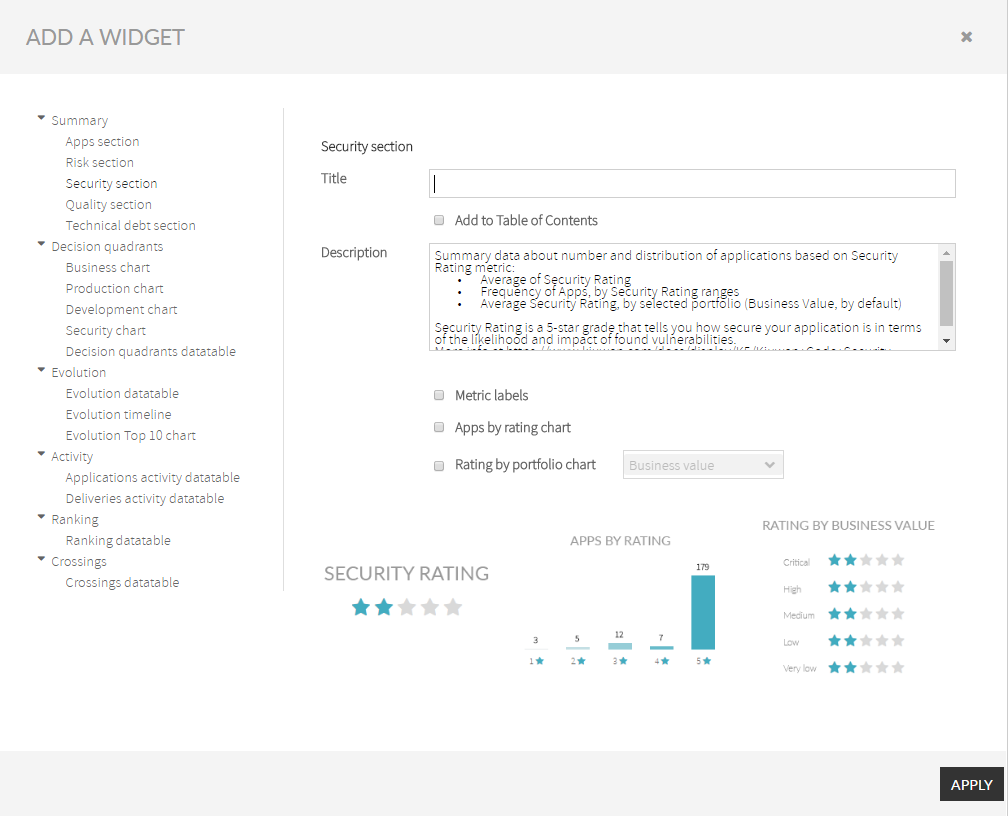
Security Section
...
Please, visit Kiuwan Code Security for further information.
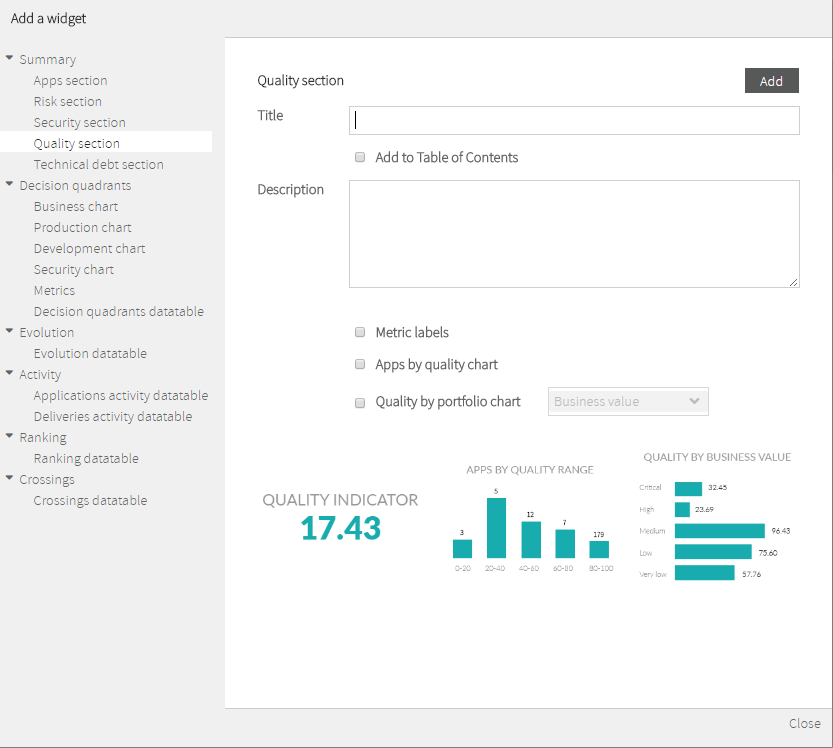
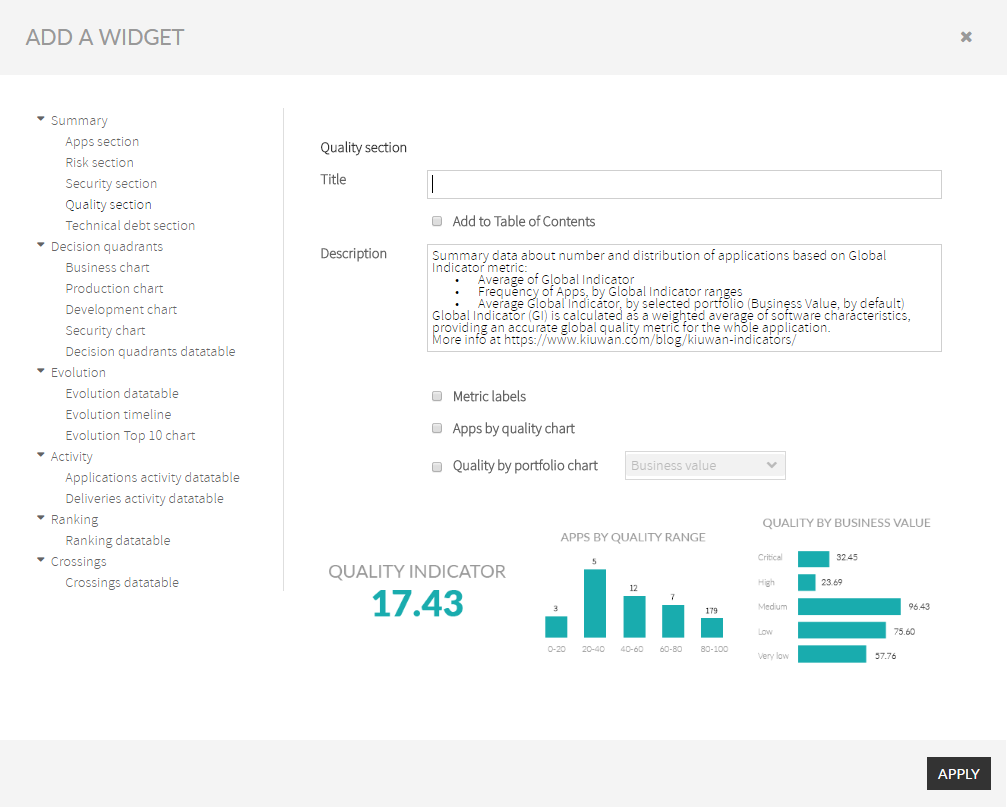
Quality Section
...
- Average of Global Indicator
- Number of Apps, grouped by Global Indicator ranges
- Average Global Indicator by selected portfolio values (Business Value, by default)
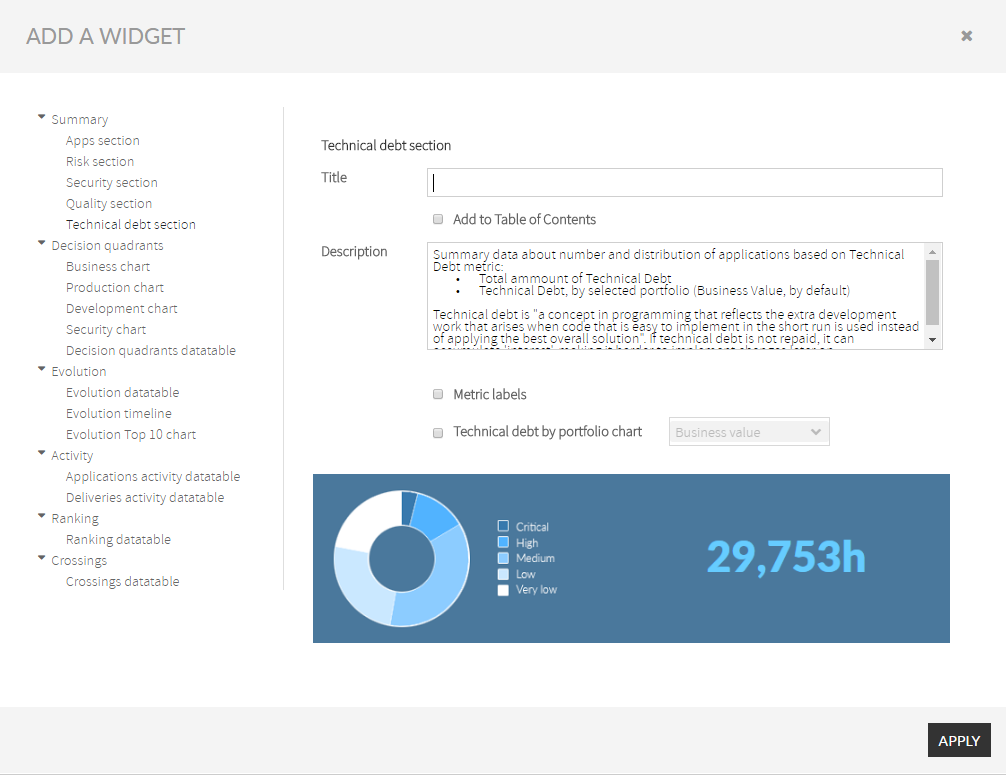
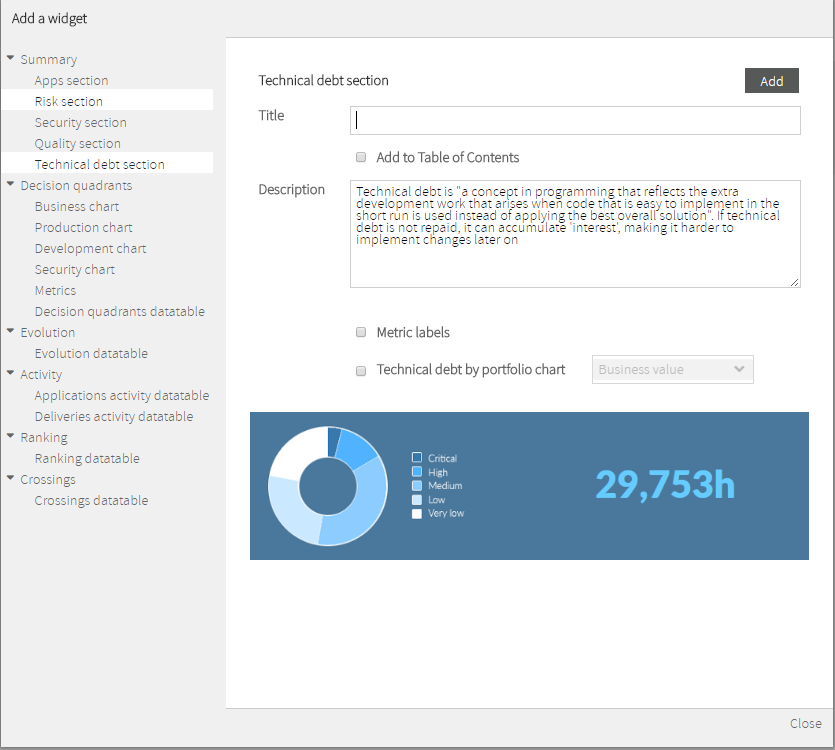
Technical Debt Section
...
- Total ammount of Technical Debt
- Distribution of Technical Debt by selected portfolio values (Business Value, by default)
Decision Quadrants Group
Decision Quadrants widgets represent graphically where your applications are depending on their business value, failure probability, maintenance risk and security risk.
...
Business chart Widget graphically displays a quadrant where apps (or groups of apps) are placed according to Business Value (Y-Axis).
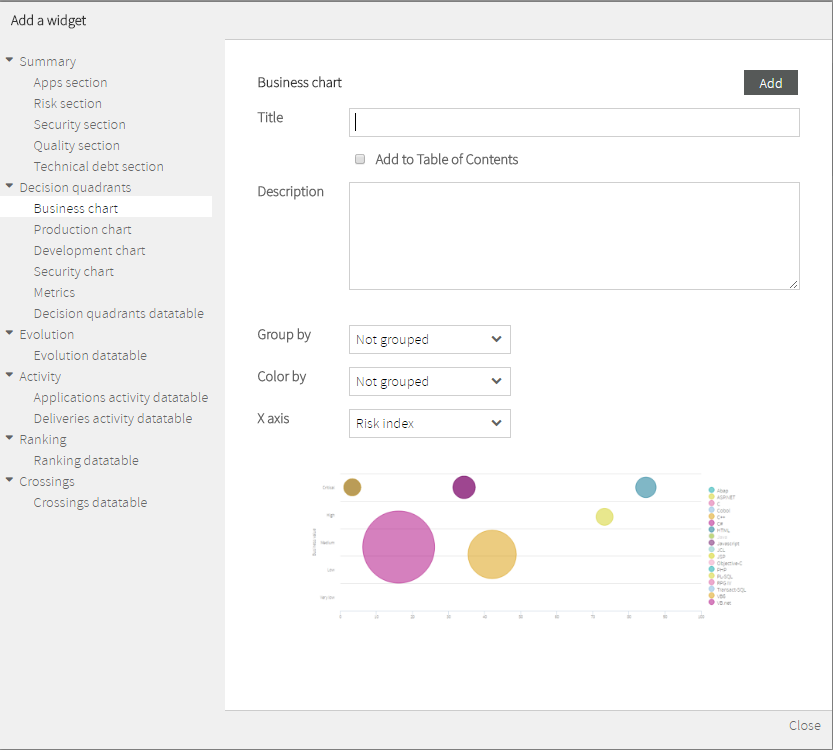
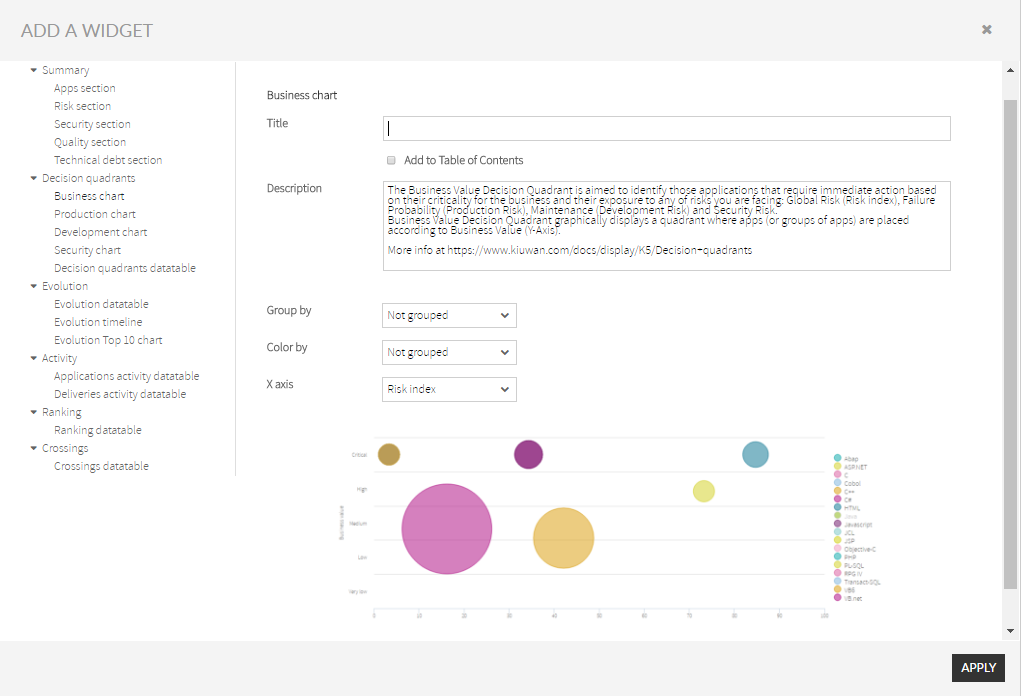
X-Axis can be customized to display the available types of Risks:
...
The applications with higher exposure to this kind of risk will be those in the upper-right area of the quadrant.
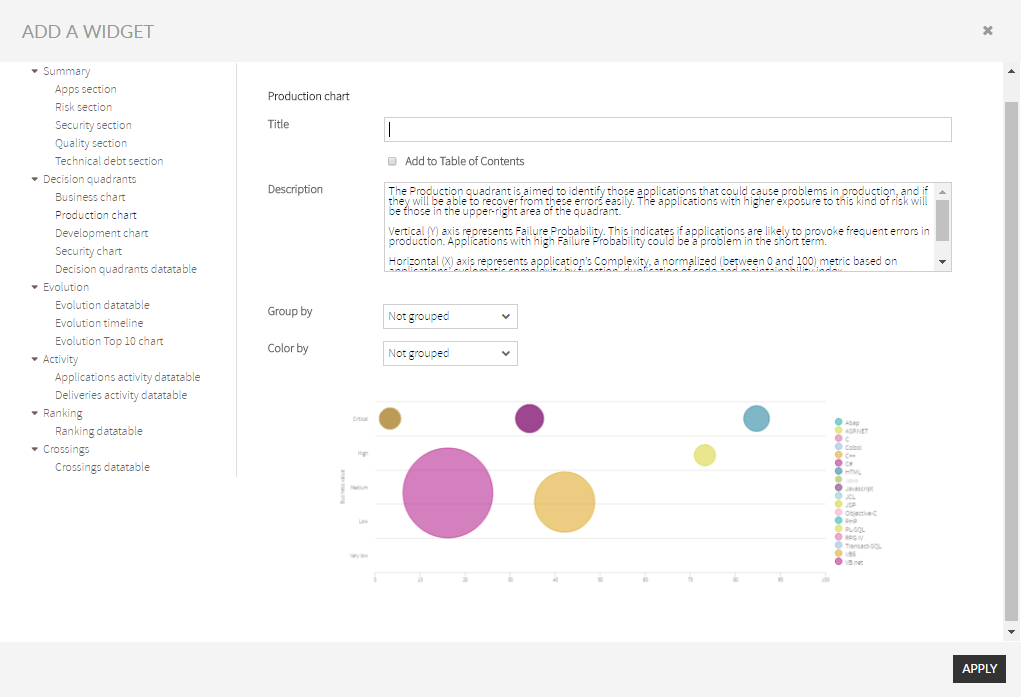
Vertical (Y) axis represents Failure Probability. This indicates if applications are likely to provoke frequent errors in production. Applications with high Failure Probability could be a problem in the short term.
...
The applications with higher exposure to this kind of risk will be those in the upper-right area of the quadrant.
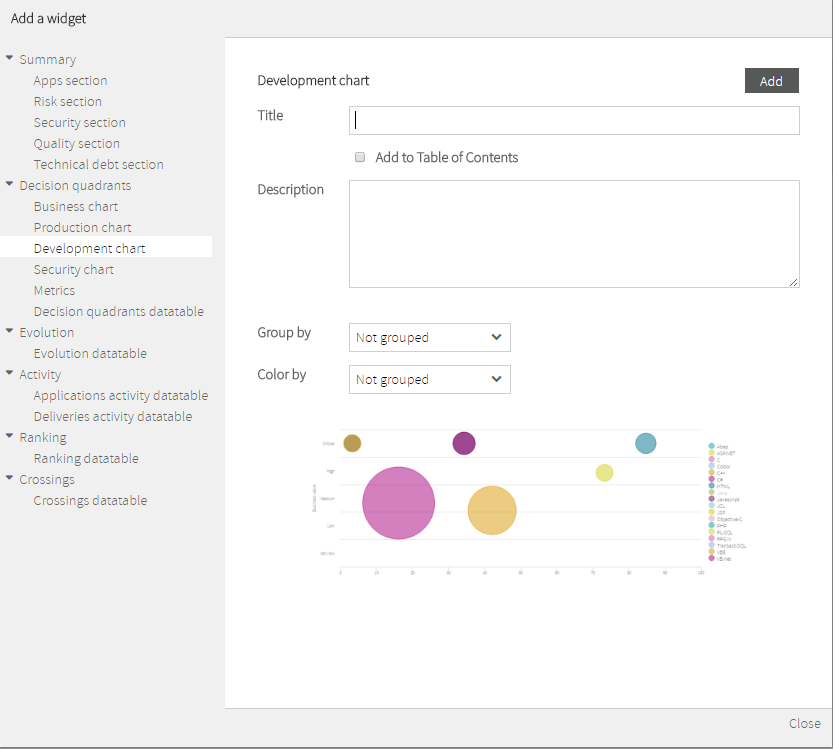

In the vertical axis we represent the Maintenance Risk: this indicates if applications’ maintenance costs are going to be higher than expected, or if it is going to be complex and costly to add new functionality to them. It is based on the evidence gathered from the code for the maintainability index.
...
The applications with higher exposure to this kind of risk will be those in the upper-right area of the quadrant.
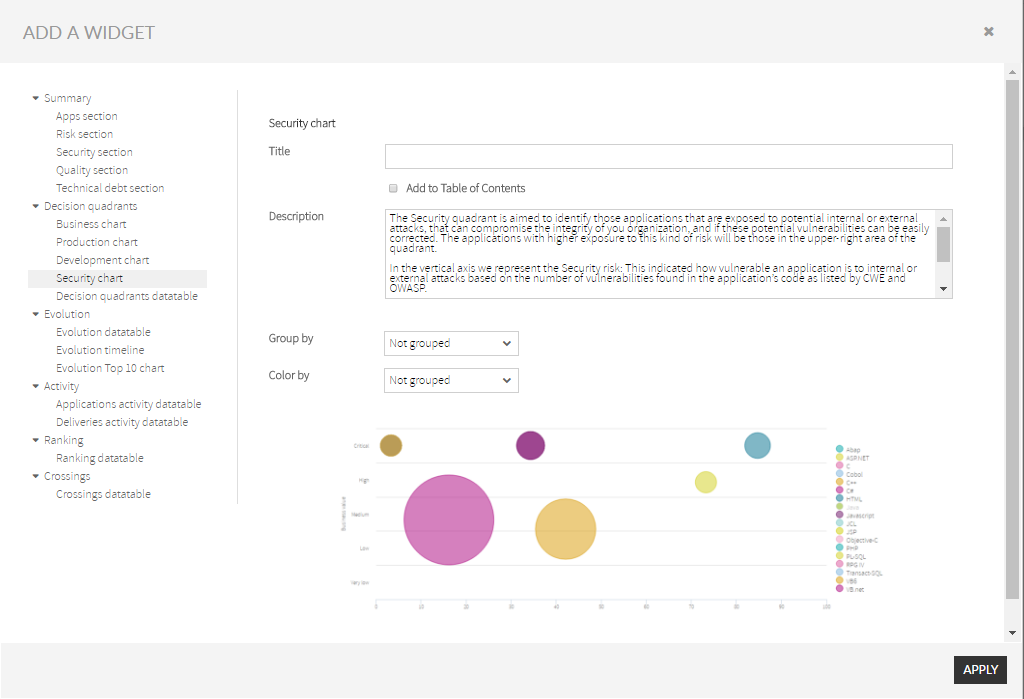
In the vertical axis we represent the Security risk: This indicated how vulnerable an application is to internal or external attacks based on the number of vulnerabilities found in the application’s code as listed by CWE and OWASP.
...
- Business Value
- Complexity
- Risk Index
- Failure Risk
- Maintenance Risk
- Security Risk
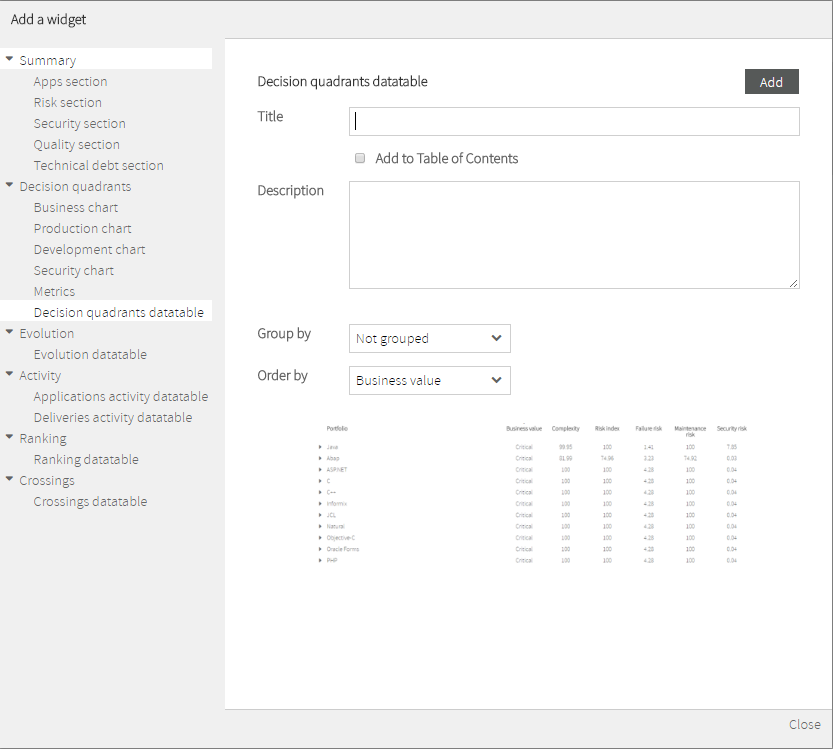
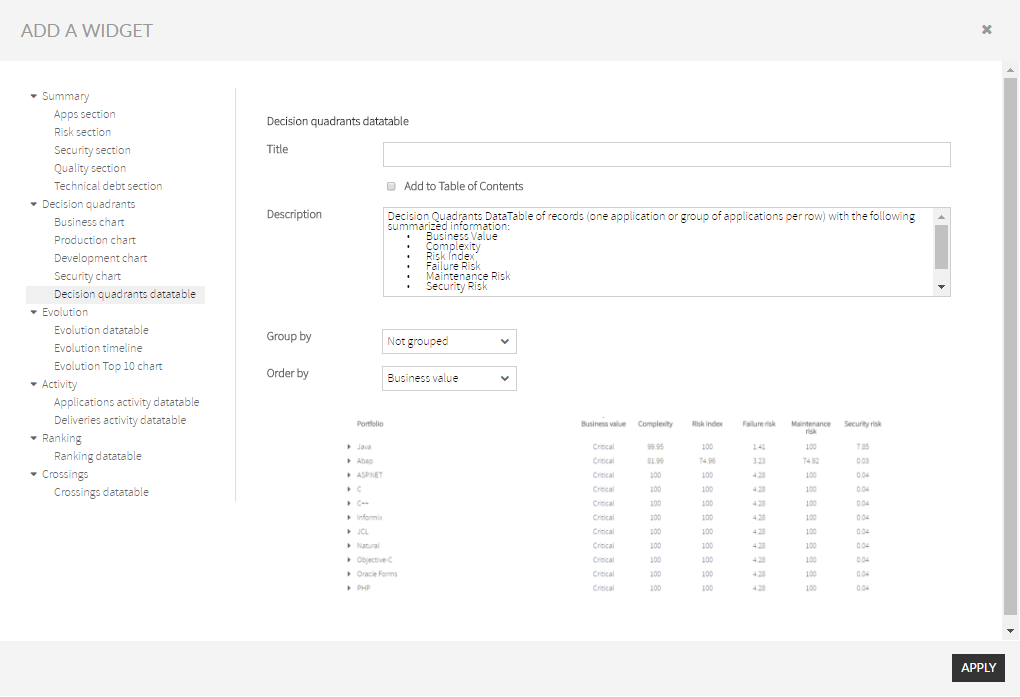
Every record can be customized to represent:
...
Available widgets:
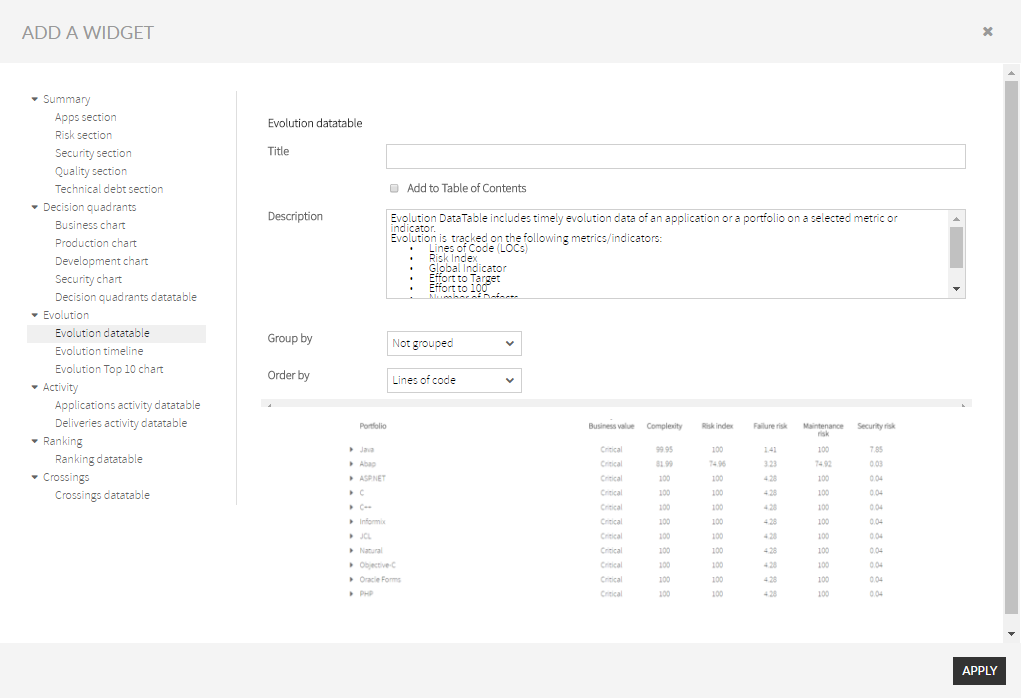
- Evolution DataTable
- Evolution Timeline
- Evolution Top 10 chart
For a fully understanding on Governance - Evolution, please visit Evolution.
...
For a fully understanding on Governance - Evolution, please visit Evolution.
Values for these metrics will be “signed” numbers that represent increments (+) or decrements (-) in the metric/indicator during the selected period of time.
...
Additionally, the data table records can be ordered by any of the above columns by using the Order by selector.
Activity Group
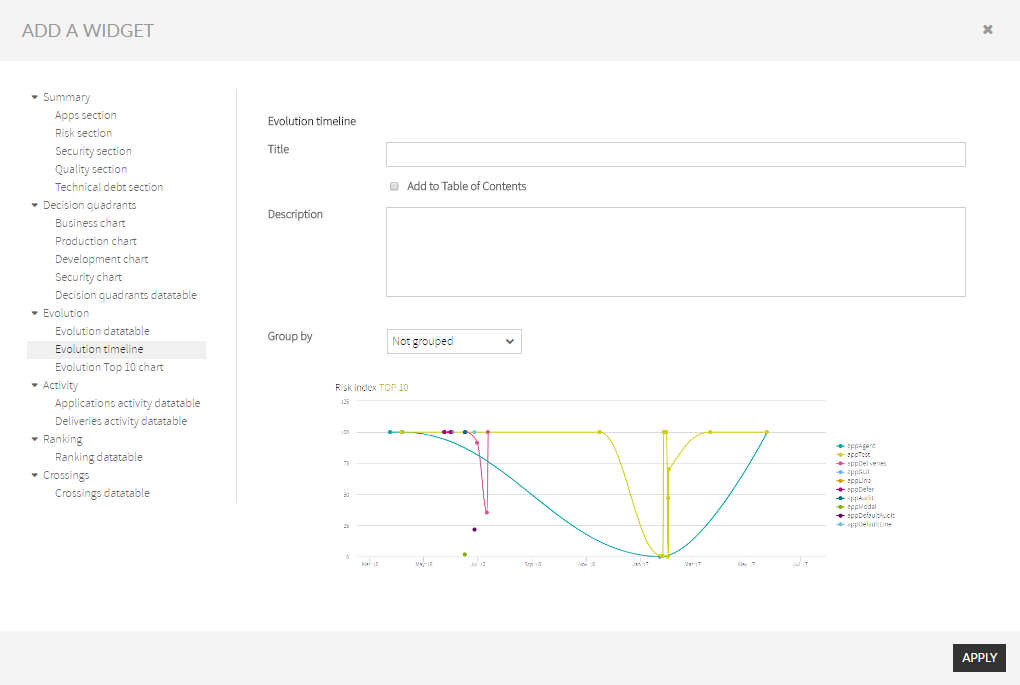
Evolution Timeline
Evolution Timeline widget displays timely evolution data of an application or a portfolio Activity widgets display applications activity on a selected metric or indicator during a certain period of time.
Changes in activity can be viewed for a specific application or for those applications that belongs to a selected portfolio.
Available widgets:
- Applications activity datatable
- Deliveries activity datatable
For a fully understanding on Governance - Activity, please visit Activity.
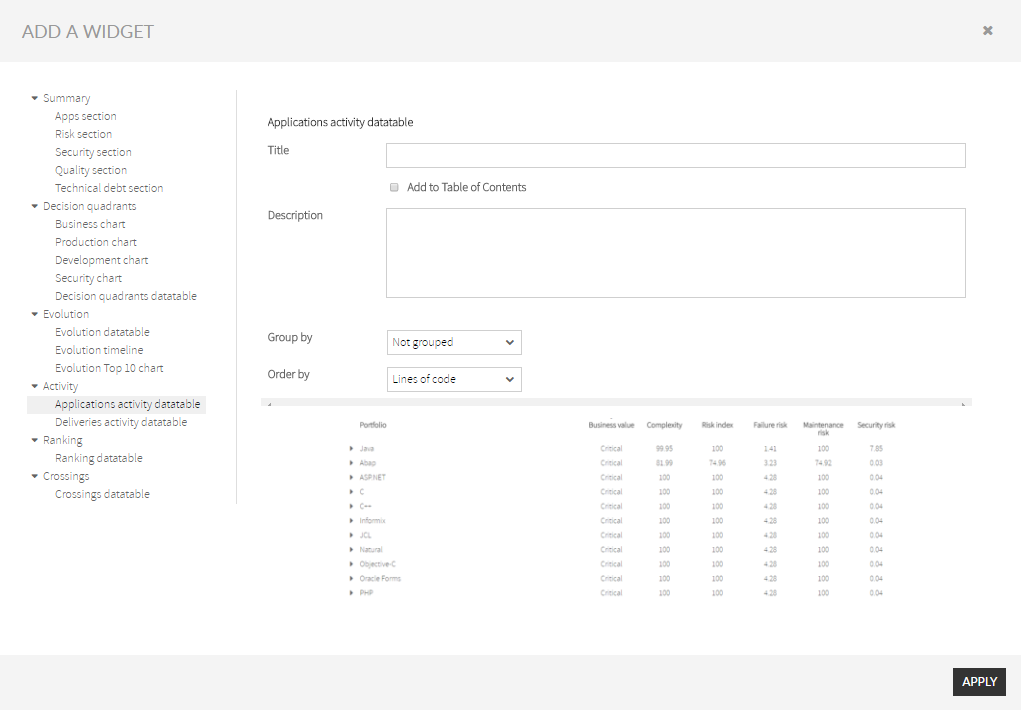
Applications Activity DataTable
Applications Activity DataTable Widget includes changes data of an application or a portfolio on a selected metric or indicator.
.
At the current moment, only Risk Index metric is available.
Points in the displayed graphic can be customized (by Group by selector) to represent:
- Individual applications (setting Group By to “Not grouped”)
- Groups of applications (grouped by any of the available portfolios in Group by selector)
Evolution Top 10 chart
Evolution Top 10 chart widget displays differential data fpr top 10 applications on a selected metric or indicator.
At the current moment, only Risk Index metric is available.
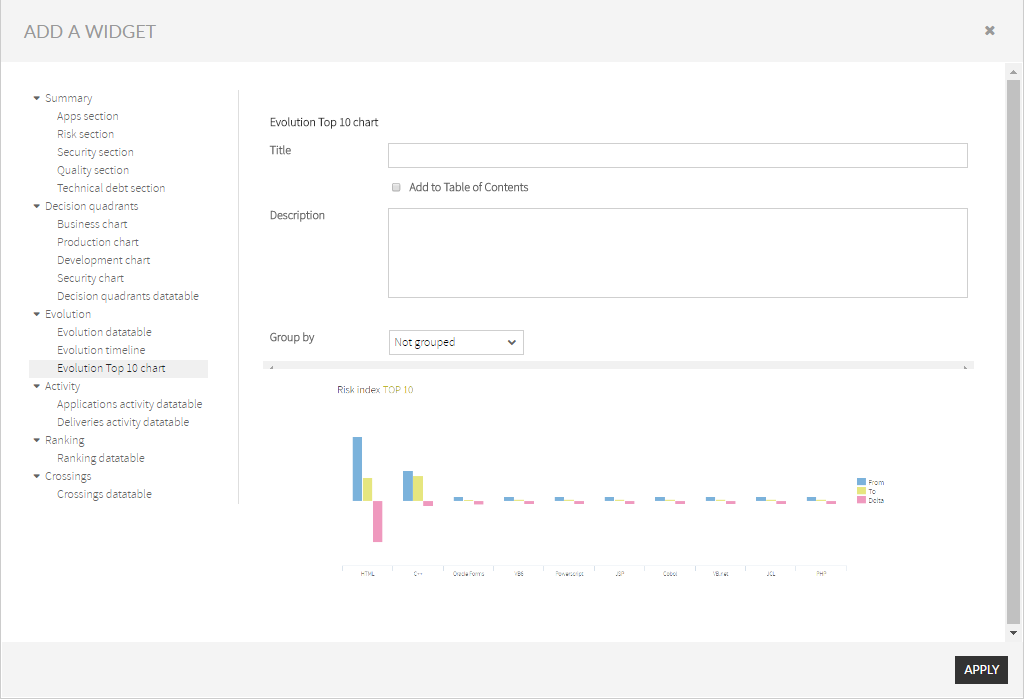
Points in the displayed graphic can be customized (by Group by selector) to represent:
- Individual applications (setting Group By to “Not grouped”)
- Groups of applications (grouped by any of the available portfolios in Group by selector)
Activity Group
Activity widgets display applications activity on a selected metric or indicator during a certain period of time.
Changes in activity can be viewed for a specific application or for those applications that belongs to a selected portfolio.
Available widgets:
- Applications activity datatable
- Deliveries activity datatable
For a fully understanding on Governance - Activity, please visit Activity.
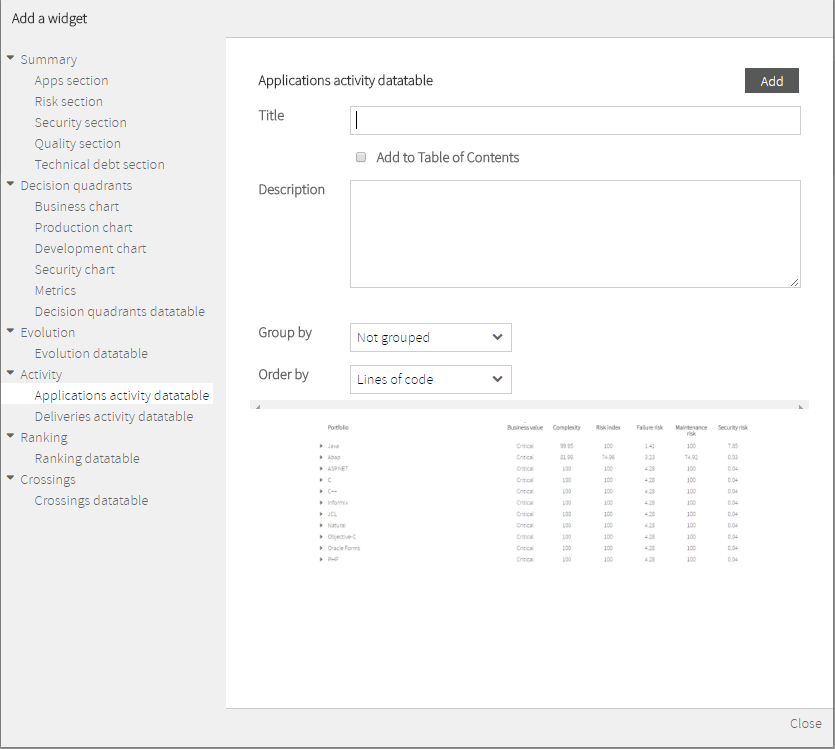
Applications Activity DataTable
Applications Activity DataTable Widget includes changes data of an application or a portfolio on a selected metric or indicator.
Activity can be tracked on the following metrics/indicators:
- Lines of Code (LOCs)
- Risk Index
- Global Indicator
- Effort to Target
- Effort to 100
- Number of Defects
For a fully understanding on Governance - Activity , please visit Activity.
Values for these metrics will be “signed” numbers that represent increments (+) or decrements (-) in the metric/indicator since the beginning of the selected period.
Every record can be customized to represent:
- One individual application (setting Group by selector to “Not grouped”)
- Groups of applications (grouped by the different values of selected portfolio in Group by selector)
Additionally, the data table records can be ordered by any of the above columns by using the Order by selector.
Deliveries Activity DataTable
Deliveries Activity DataTable Widget includes activity data of application's deliveries .
For every application, deliveries activity Activity can be tracked on the following metrics/indicators:
- Lines of Code (LOCs)
- Risk Index
- Global Indicator
- Effort to Target
- Effort to 100
- Number of Defects
For a fully understanding on Governance - Activity , please visit Activity.
- No of Baselines
- No of Change requests (total, OK and Failed)
- No of Deliveries (Total, Ok and Failed)
- etc.
For a fully understanding on Governance - Activity , please visit Activity.
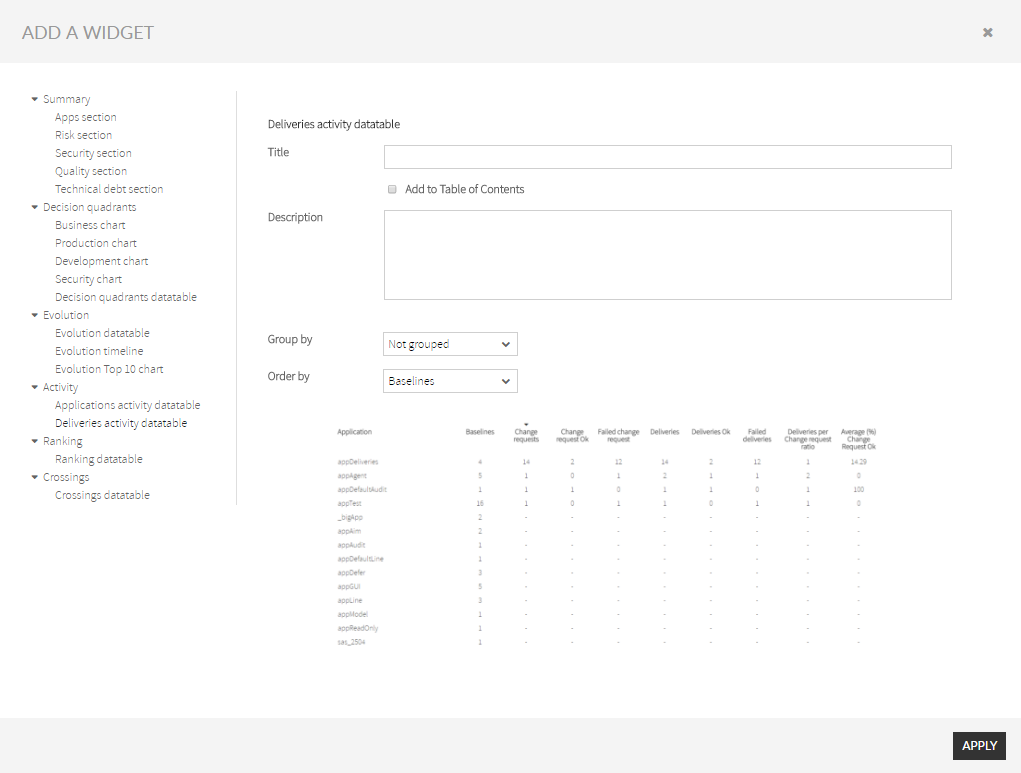 Values for these metrics will be “signed” numbers that represent increments (+) or decrements (-) in the metric/indicator since the beginning of the selected period.
Every record can be customized to represent:
- One One individual application (setting setting Group by selector selector to “Not grouped”)
- Groups of applications (grouped by the different values of selected portfolio in in Group by selector selector)
Additionally, the data table records can be ordered by any of the above columns by using the the Order by selector.
...
selector.
Ranking Group
Ranking widgets display rankings of applications (or applications grouped by portfolios) on a selected metric or indicator.
...
- Business Value
- Lines of Code (LOCs)
- Risk Index
- Global Indicator
- Effort to Target
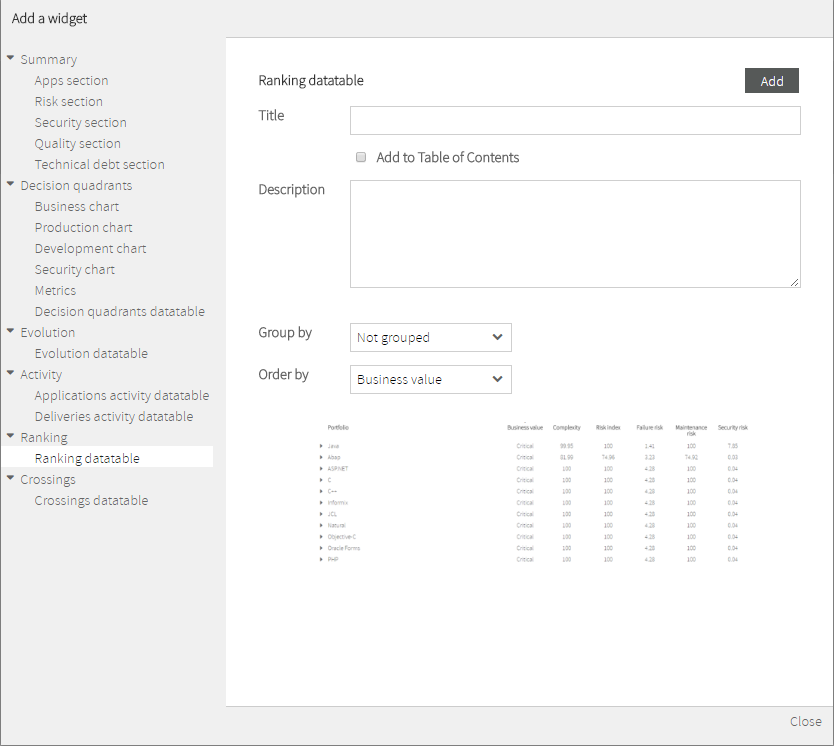
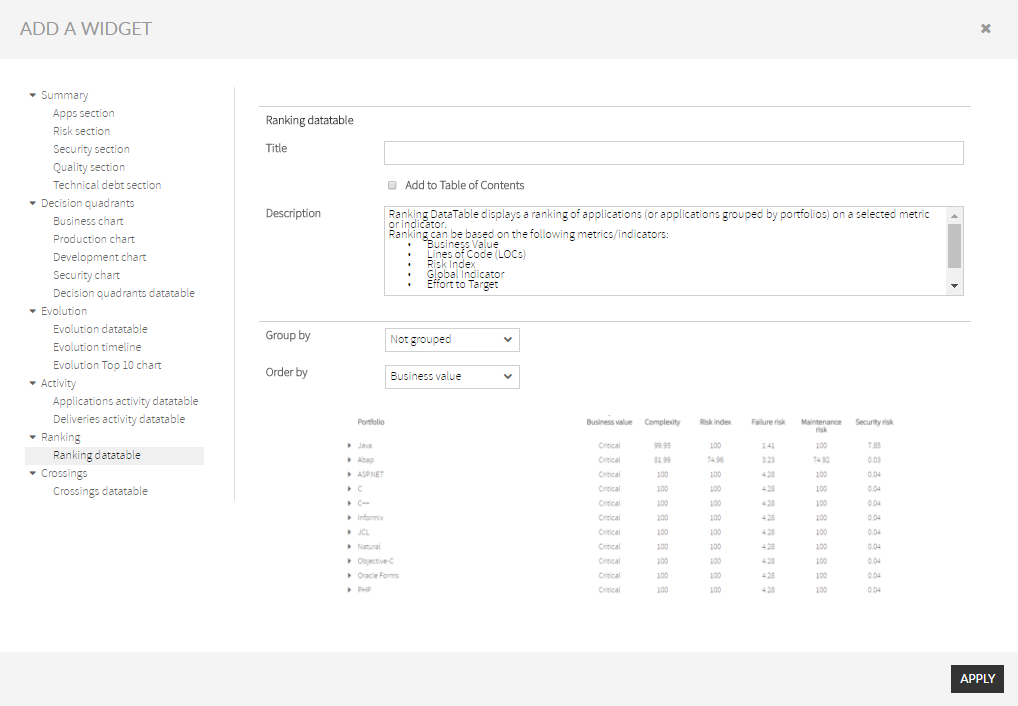
Every record can be customized to represent:
...
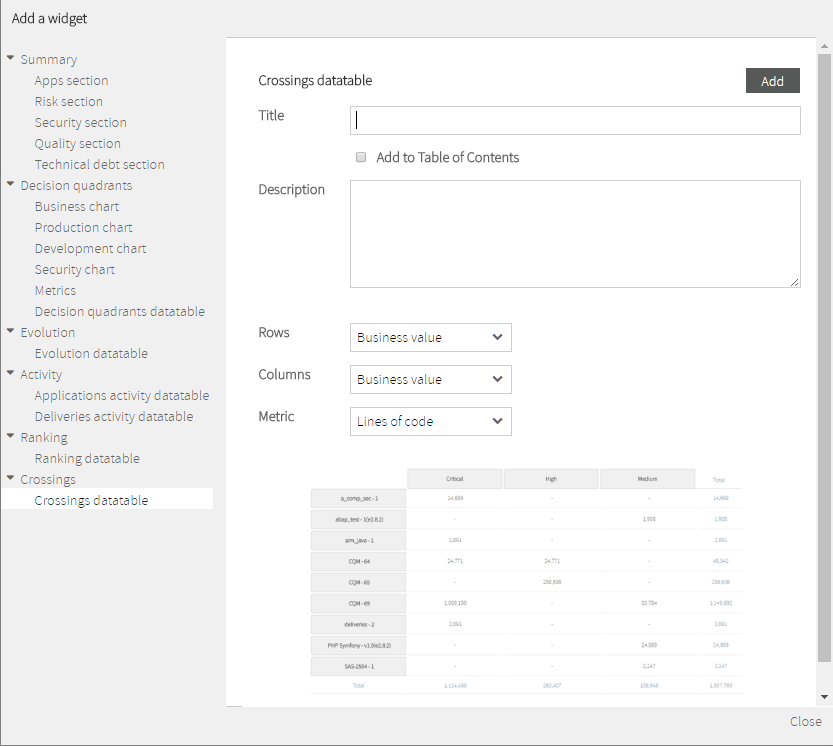
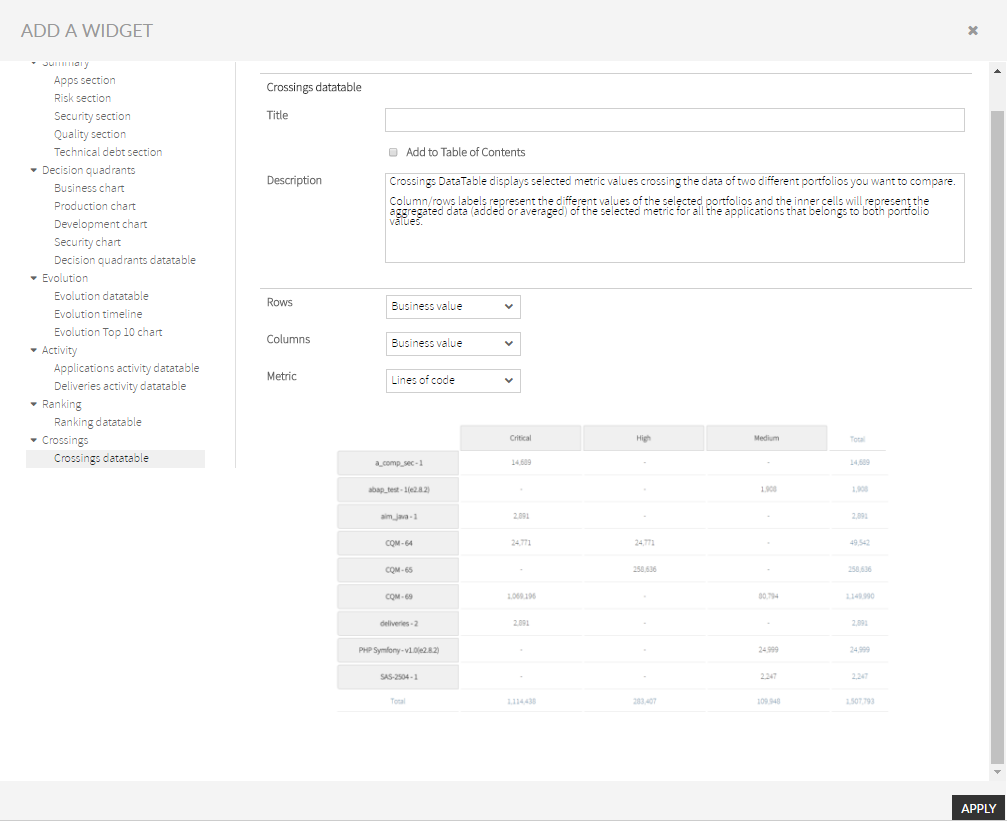
As a result, you will get a table where column/rows labels represent the different values of the selected portfolios and the inner cells will represent the aggregated data (added or averaged) of the selected metric for all the applications that belongs to both portfolio values.
you publish it (to make it generally available to the rest of the users)