...
Below you can find available widgets grouped by cathegory.
Summary
...
Group
| Info |
|---|
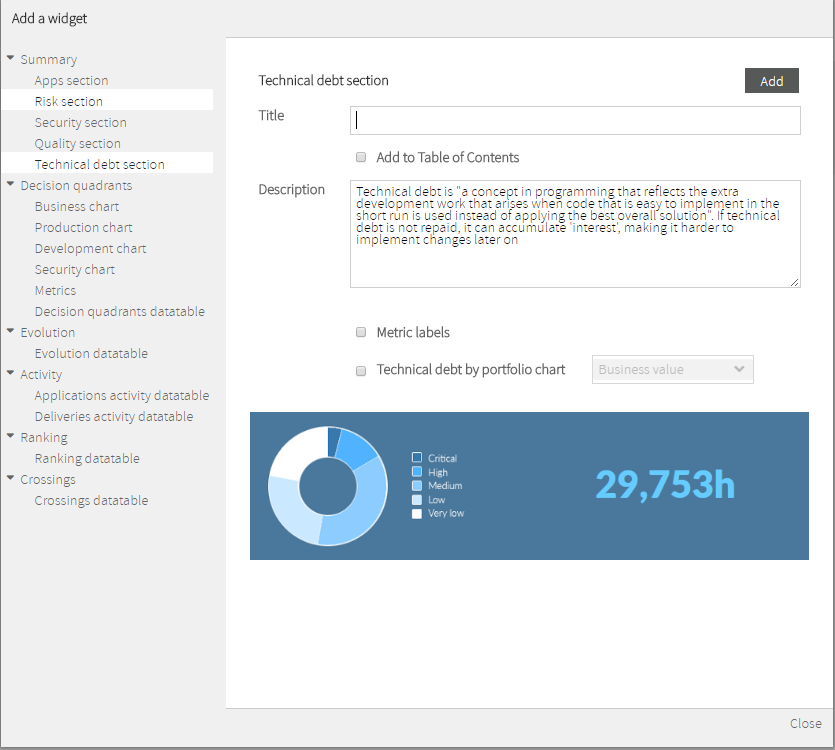
Summary widgets allow to display global (aggregated) information about application metrics. |
...
- Total ammount of Technical Debt
- Distribution of Technical Debt, by selected portfolio (Business Value, by default)
Decision quadrants Group
Decision Quadrant widgets represent graphically where your applications are depending on their business value, failure probability, maintenance risk and security risk.
...
Additionally, the data table records can be ordered by any of the above columns by using the Order by selector.
Evolution Group
Evolution widget display timely evolution of an application or a portfolio on a selected metric or indicator.
...
Additionally, the data table records can be ordered by any of the above columns by using the Order by selector.
Activity Group
Activity widgets display applications (activity) on a selected metric or indicator during a certain period of time.
...
Deliveries Activity DataTable (XXXXXXXXXXXXXX)
Ranking Group
Ranking widgets are those that allow to display rankings of applications (or applications grouped by portfolios) on a selected metric or indicator.
...
Additionally, the data table records can be ordered by any of the above columns by using the Order by selector.
Crossings Group
Crossings widgets are those that allow to display a table where you can pick the metric whose values you want to see, crossing the data of two different portfolios you want to compare.
...