In this short guide, we will show you how to manage the different analyses you have done with Kiuwan.
Content:
| Table of Contents |
|---|
If you haven't done an analysis yet, find out here how to start a new analysis, with Kiuwan Local Analyzer or with the Cloud Analyzer.
Once the analysis is finished, go through the following steps.
Open the analysis log of a specific analysis
| Table of Contents |
|---|
Start a new analysis
You can analyze the source code in two ways:
- With the Kiuwan Local Analyzer (which you download and install on your computer).
- Or with the Kiuwan Cloud Analyzer.
Log into kiuwan.com.
Select Code Analysis
and Summary fromfrom the main menu.
Select Summary.
- Select on the left menu the correct application.
- Select from the drop-down menu which analysis you want to view.
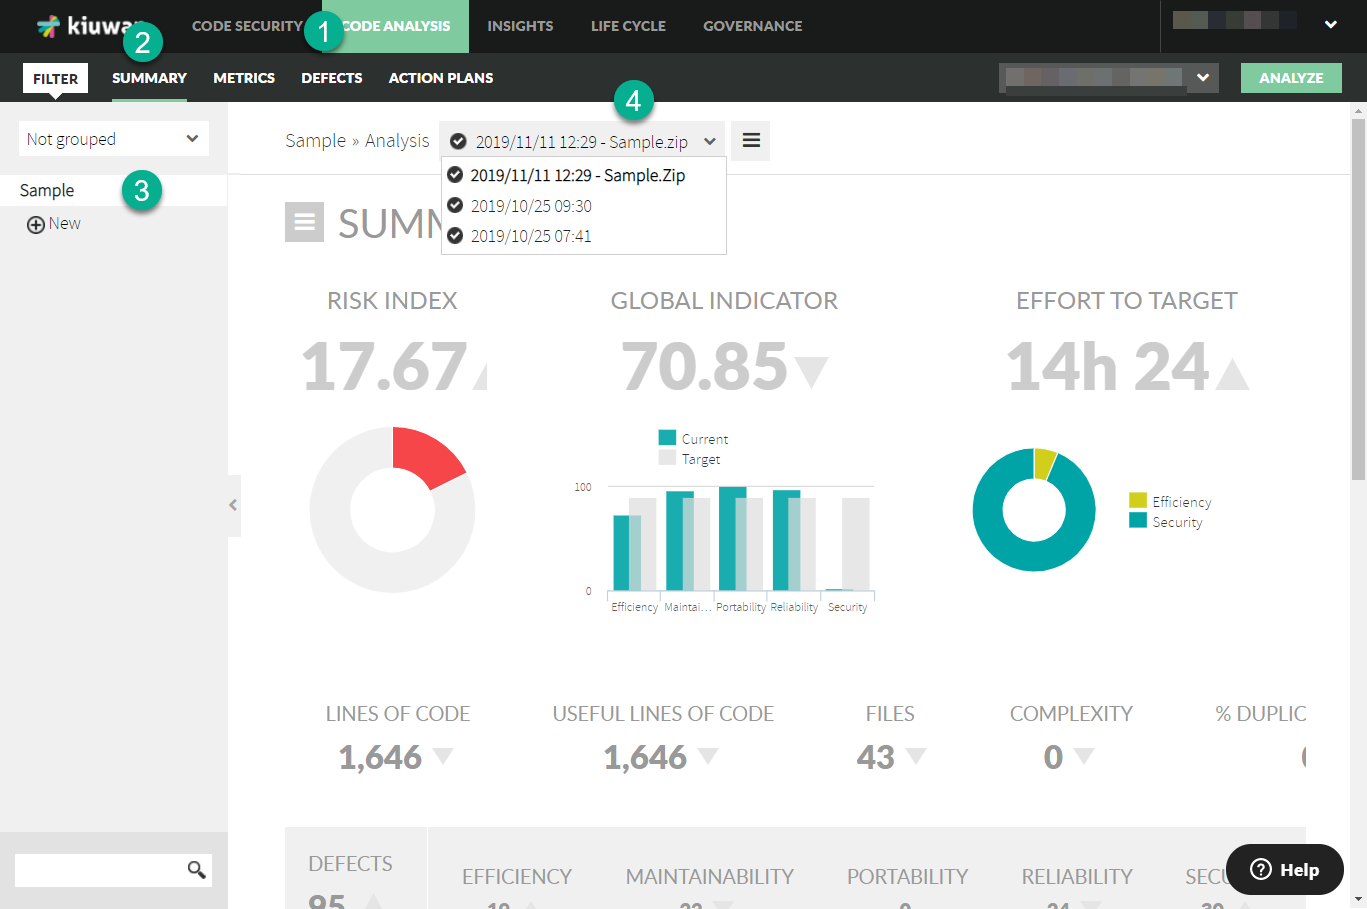
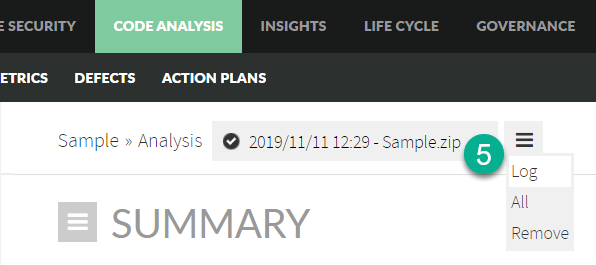
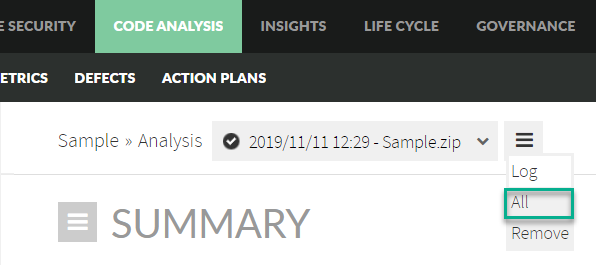
- Select Log from the hamburger menu.
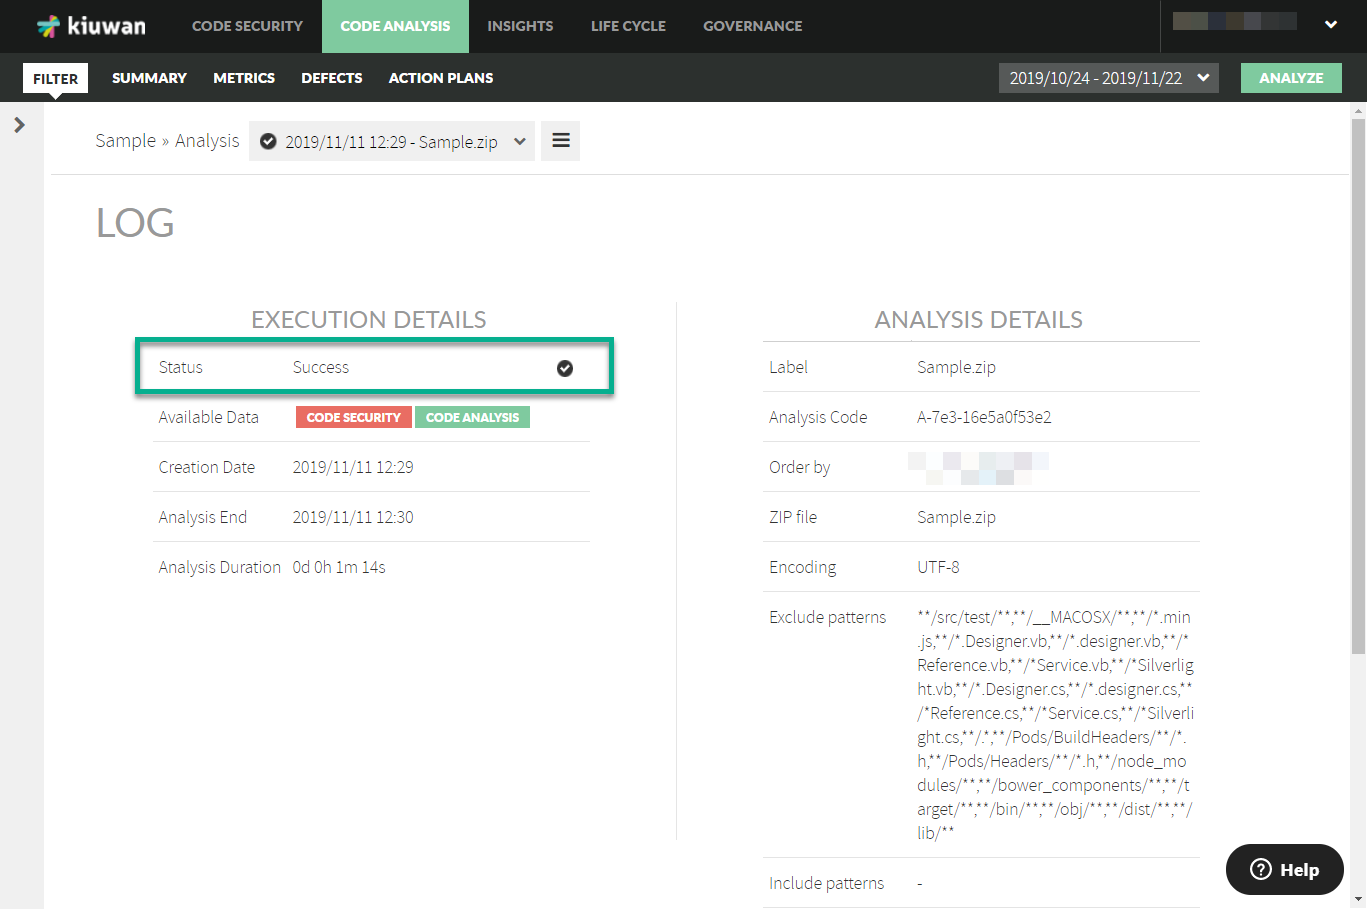
- In the new window, you can see in the Status field if the analysis was successful or not.
- If it failed, you will see an error code. Read more here at Analysis Error Code Reference.
- If it failed, you will see an error code. Read more here at Analysis Error Code Reference.
All view
View all analyses
- To see an overview of all analyses done on an application, select Select All from the hamburger menu
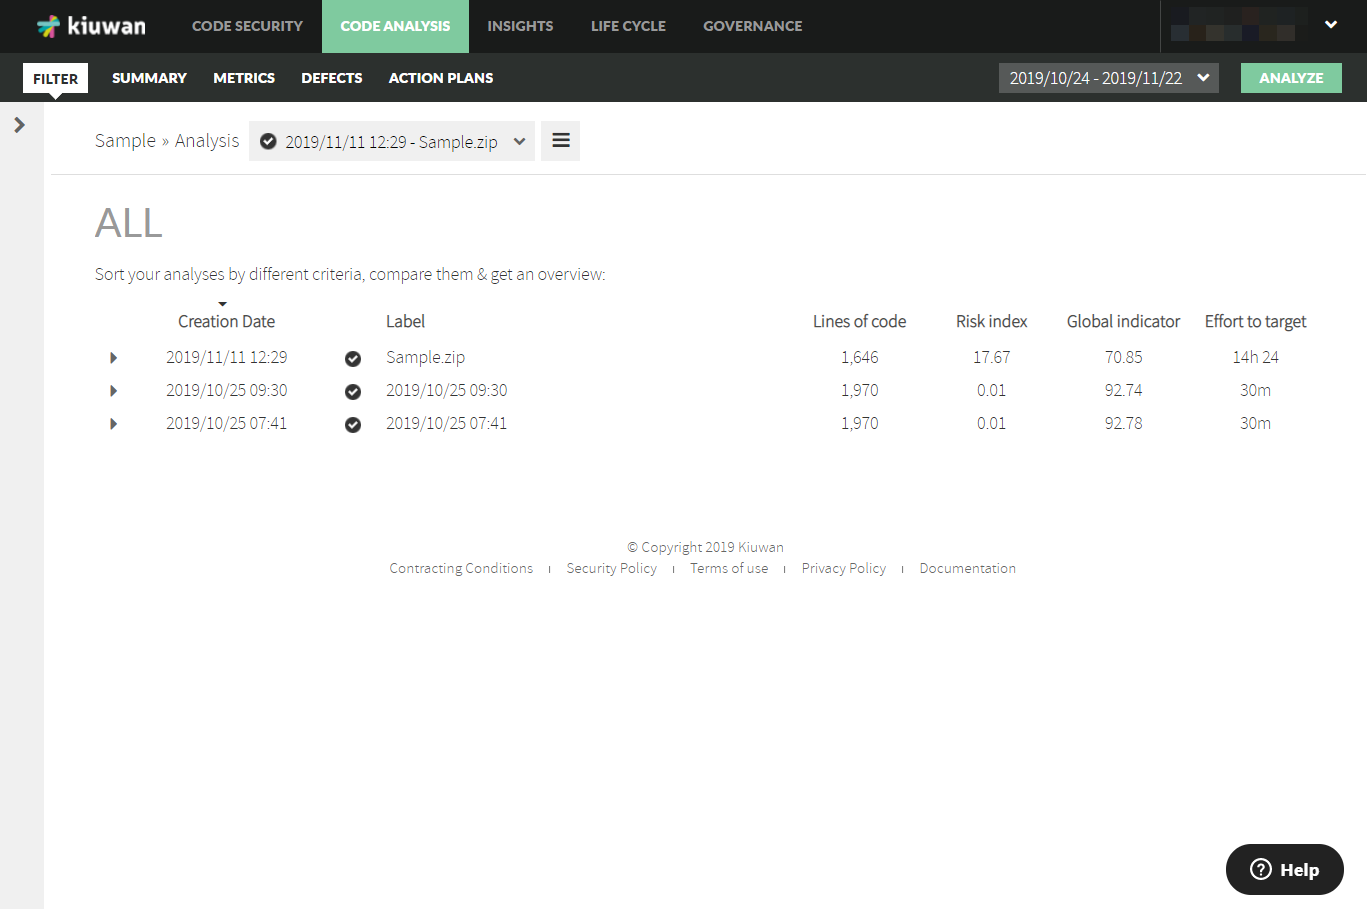
- In the new window, you can see the complete list of the analyses that were run on the selected application.
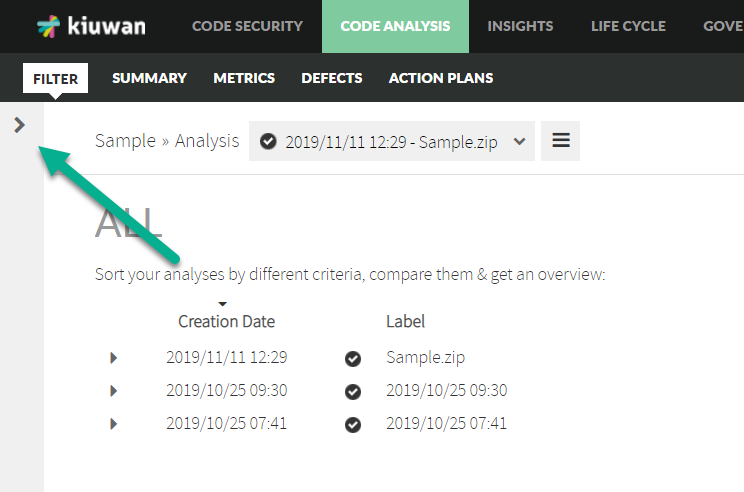
- To change select a different application, click on the arrow on the left.
By default, the list is sorted by date, but we can change this sorting criterion by clicking on the column header we want: . To change the sort order, click a different column header. The list can be sorted by label, lines of code, risk index, quality indicator, or effort to target.
If we click Click on a specific analysis , a dashboard will be displayed, showing us to display the dashboard, which has useful data , such as:
- The number of files in that application.
- The lines of code that application has.
- The values of the quality main indicators:
- Effort to target
- Quality indicator
- The position of that application in the ranking, depending on its quality value.
- The distance to the top, measured in quality.
- The date of the last analysis run.
- The quality model used in that last analysis.
- The value of the complexity by function.
- The number of defects found and the number of the ones muted, if any.
- The duplicated code ratio.
- The graphing of the quality main indicators mentioned above.
- The graphing of the distribution in languages of the lines of code.
Removing an analysis
Kiuwan gives you the possibility to remove an analysis from your dashboard. This may be useful if you have done a test analysis or if you want to erase an analysis you do not need anymore.
| Warning |
|---|
Removing an analysis is permanent. It cannot be undone. |
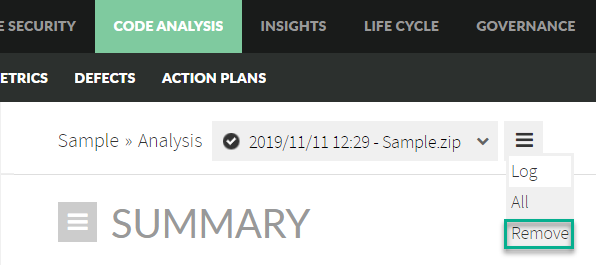
To If we want to remove an analysis, select Remove from the hamburger menu.