This guide will show you how to integrate Kiuwan into JetBrains TeamCity.
Contents:
| Table of Contents |
|---|
How to run a Kiuwan analysis from a TeamCity build step-by-step
Requirements
- TeamCity Server installed and operational (you can download the professional edition for free here).
- TeamCity Build Agents installed, you can have as many as you need in different operating systems.
- An active Kiuwan account of course.
- Kiuwan Local Analyzer (KLA) installed in every TeamCity Agent Machine. (Read how to install it here: Install and Start Up Kiuwan Local Analyzer)
1. Create or edit a TeamCity project
Select an existing project in TeamCity or create a new one.
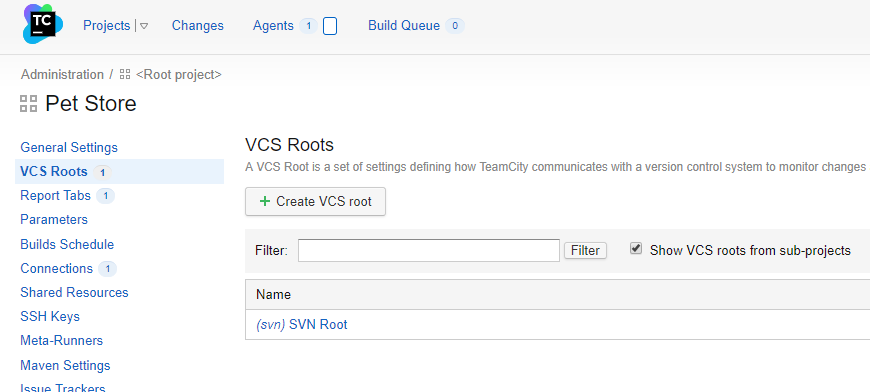
In TeamCity, every project has one or more Version Control System (VCS) associated with it. This way the agent build agents take care of extracting the source code automatically. The VCS could be basically any: SVN, Git, GitHub, BitBucket, TFS, etc.
2. Configure an analysis step in a build configuration
The next step is to configure a new build step that will run the Kiuwan analysis in a project with an existing build configuration, or to create a new build configuration to include the Kiuwan analysis step.
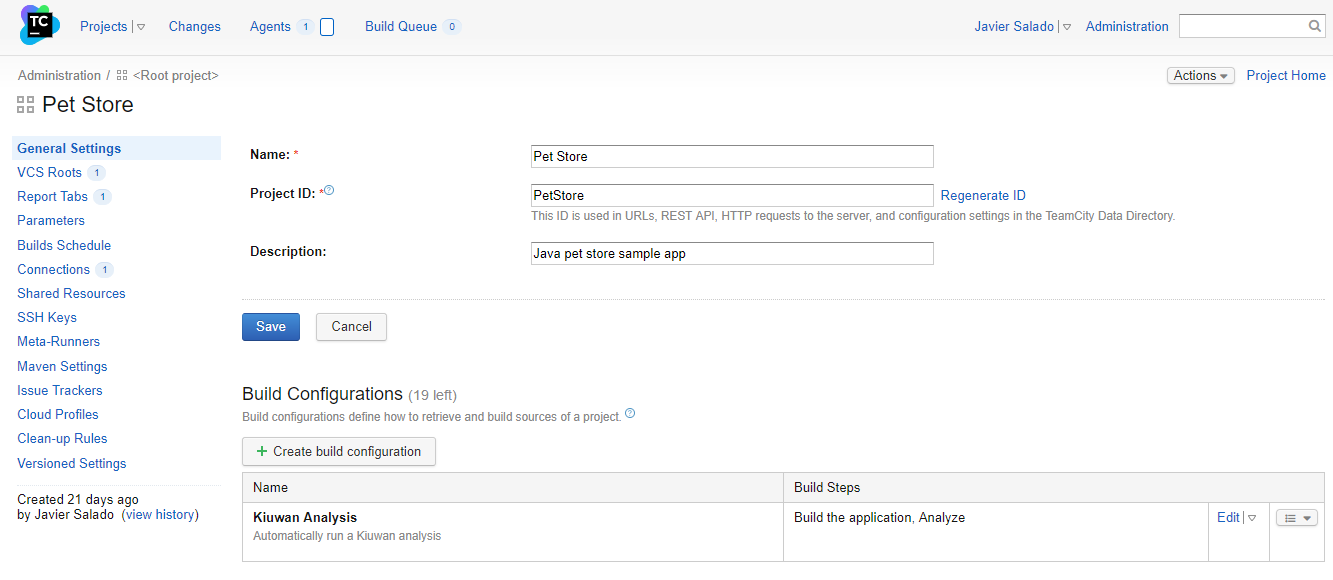
Click Create build configuration or edit an existing one in the general project settings page.
3. Define Kiuwan credentials variables
In the build configuration settings screen, the first thing to do is to define a couple of two variables that will be available for the build agent at execution time to hold your Kiuwan credentials necessary to run the analysis. Look for the parameters section in the left menu.
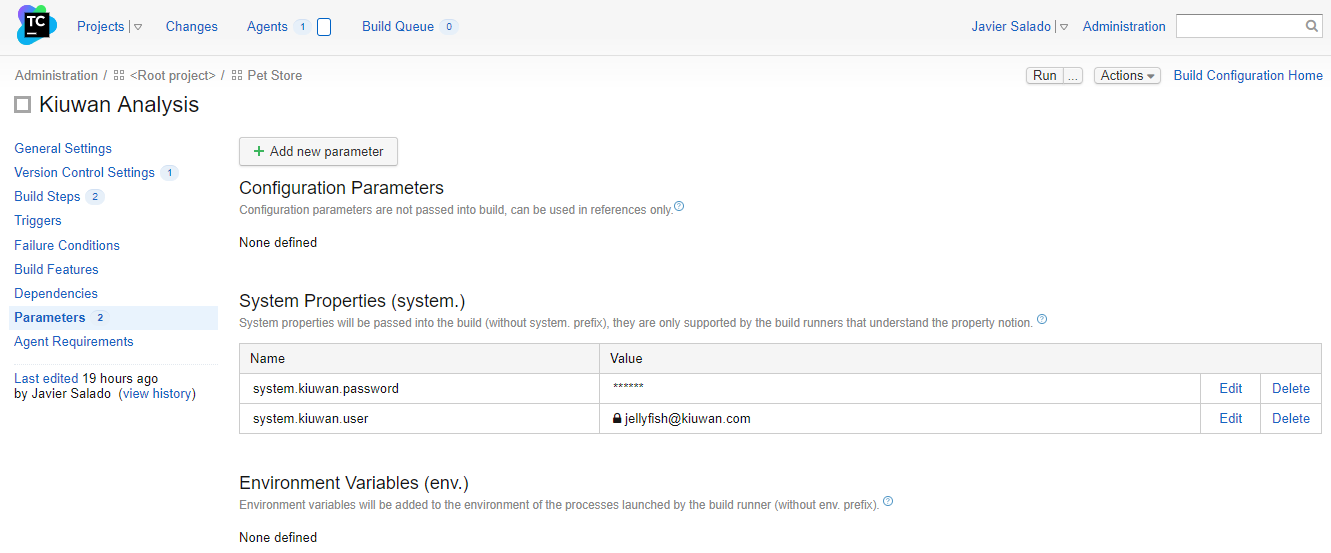
Now you have to define 2 two system-level variables: system.kiuwan.user and system.kiuwan.password. This last one can be set to type = password, so it is never displayed.
4. Define the analysis step itself
Next, in the build configuration settings screen, you have to go to the build steps configuration and create a new one to set up the analysis.
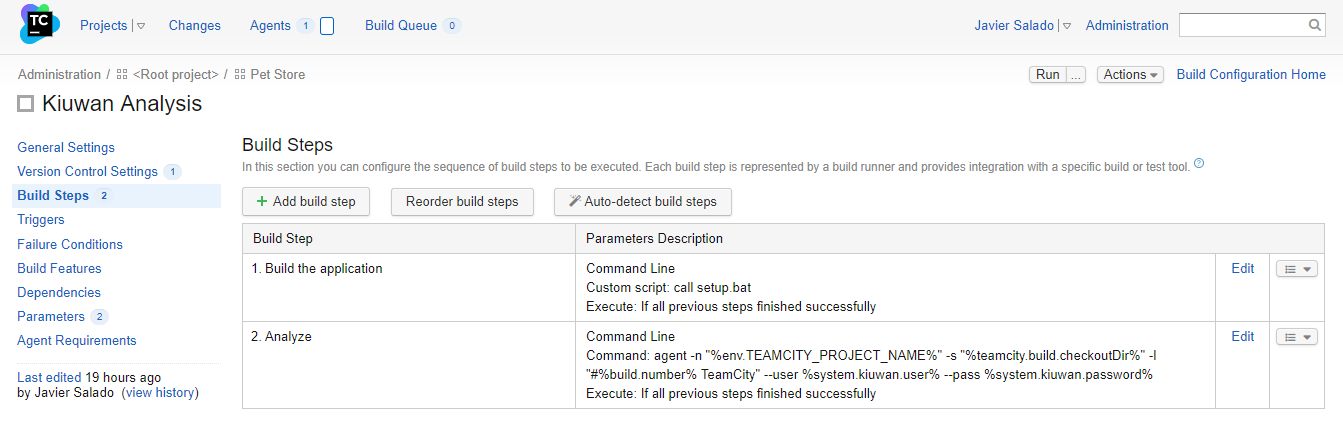
The analysis should take place after the build of the application. Here's how to configure this:
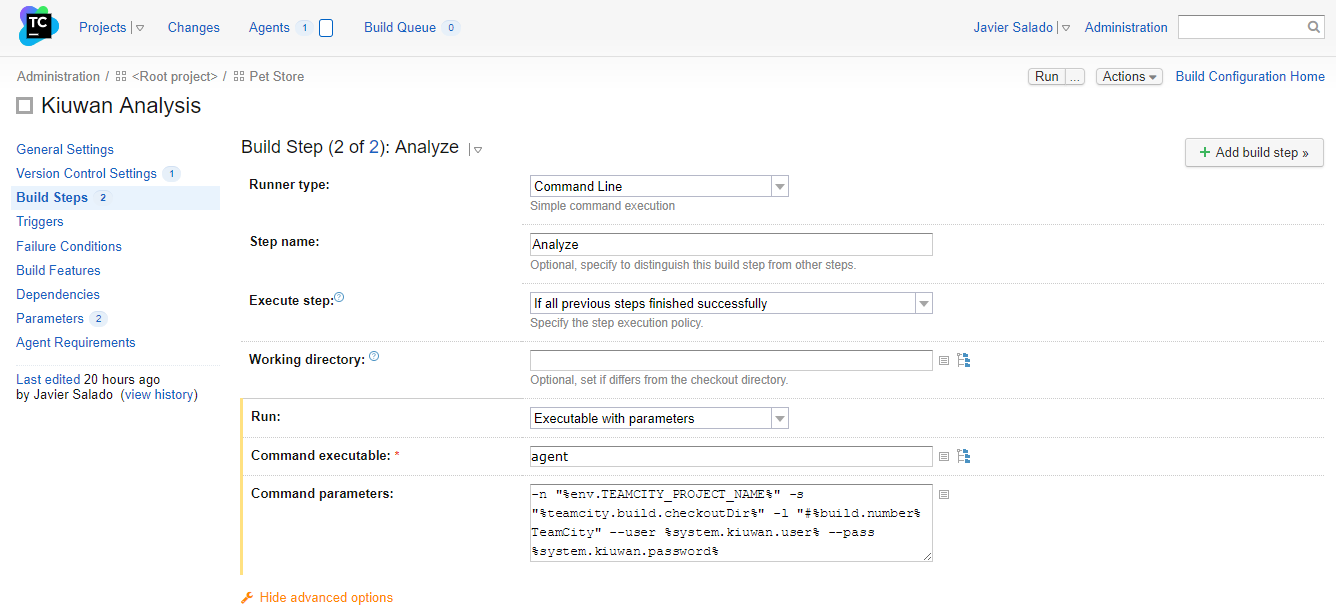
- Set the Runner type to Command line from the pulldown.
- Give the step a name.
- Decide if you want to run this step depending on the result of the previous ones.
- Leave the working directory empty to use the default VCS checkout directory.
- And now define the command and parameters to run.
- Select Executable with parameters from the dropdown menu.
- Specify
agentas the command to run and the following parameters to pass to the command:
| Code Block |
|---|
-n "%env.TEAMCITY_PROJECT_NAME%" -s "%teamcity.build.checkoutDir%" -l "#%build.number% TeamCity" --user %system.kiuwan.user% --pass %system.kiuwan.password% |
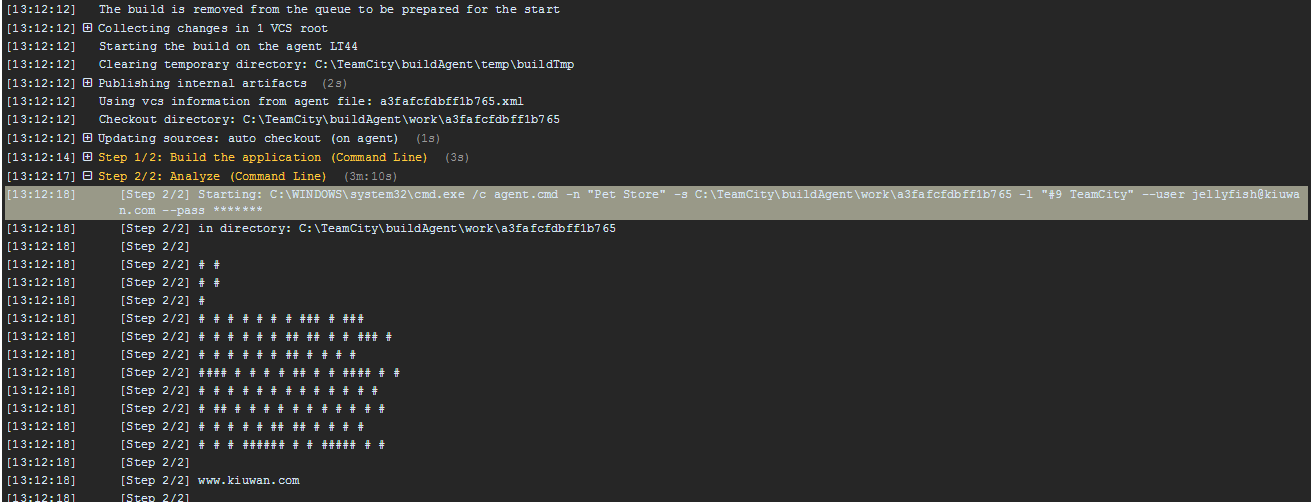
Notice that we are using TeamCity variables for the name of the application to analyze (it will be the project name), the directory where the source code is (it will be the checkout directory), a label for the analysis (it will be the build number) and the Kiuwan credentials we defined previously.
This configuration will run a Kiuwan Baseline analysis. If you want to run a delivery analysis for a change request you can define another build configuration where the analysis step will have extra parameters for the KLA agent to run a delivery analysis. Refer to Kiuwan Local Analyzer for more information on the available parameters.
5. Define a build trigger
The last thing is to define a trigger to run the build on the project on given conditions.
The typical ones will be to run a build when changes are committed to the VCS or run it periodically based on a defined schedule. TeamCity has a nice feature allowing you to run it periodically but only if there are committed changes in your VCS.
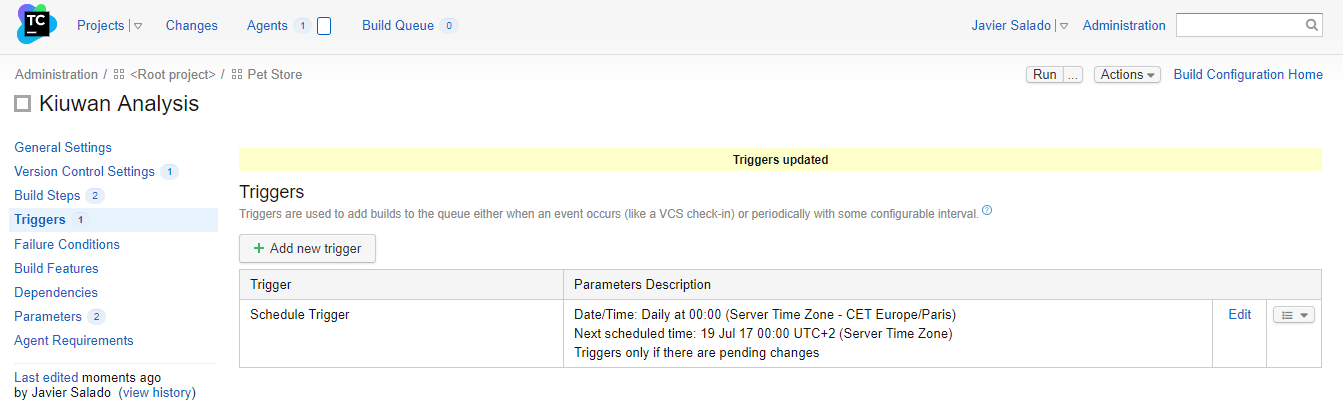
For testing purposes, you can always run your build clicking the Run button on the top right of the above screen.
6. Run the analysis
Run the analysis interactively to test the build. You can follow the execution in the build log console.
When it finishes, you can see the final result of the execution and you have a link to access the analysis results in Kiuwan.
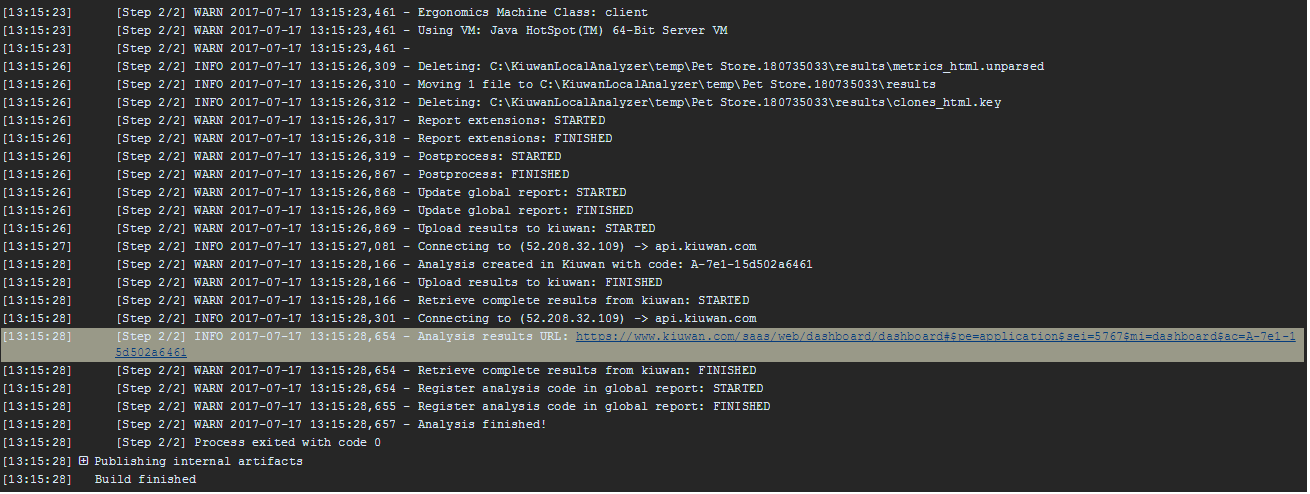
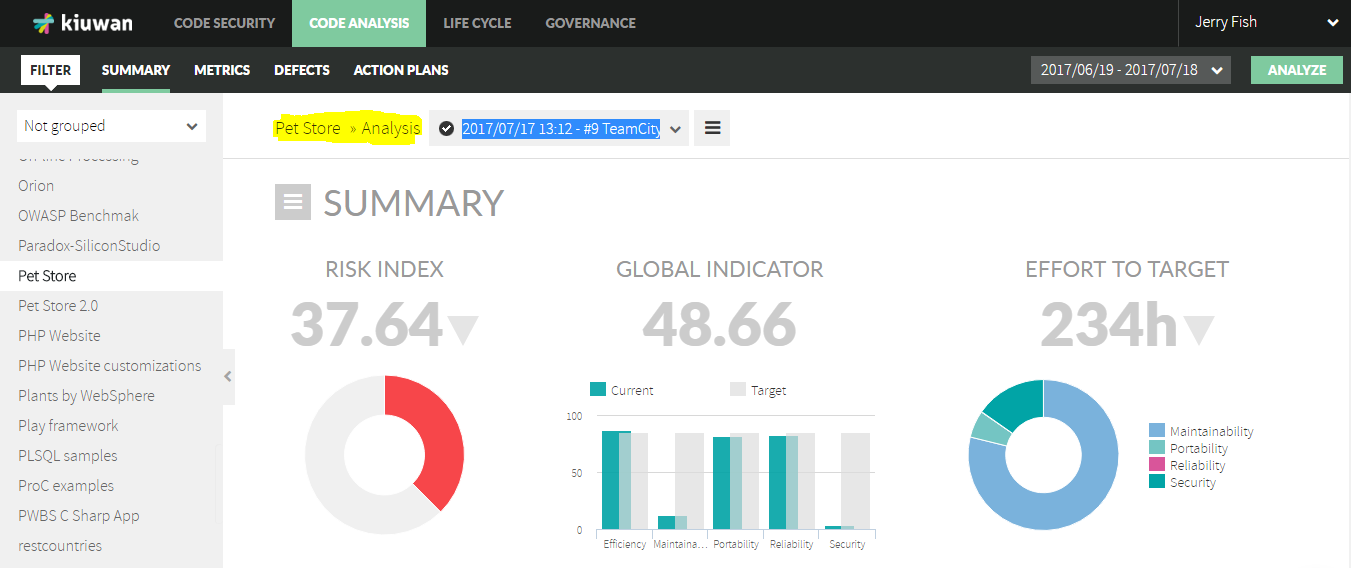
7. See the results in Kiuwan
Clicking the link will open your default browser and take you directly to the results summary page.