This guide will explain explains the Kiuwan Metrics page into in detail.
Contents:
Introduction
Go to Model Management > Metrics to access the metrics section.
 Image Modified
This section shows all the available metrics for current user users and which of them are active in the current model version. Only Kiuwan metrics are available and they are not editable, but users can tag metrics as they need. All available metrics are mandatory: , when a model is published all of them will be automatically added to the current model. This way your analyses will contain as much information about metrics as Kiuwan can give you.
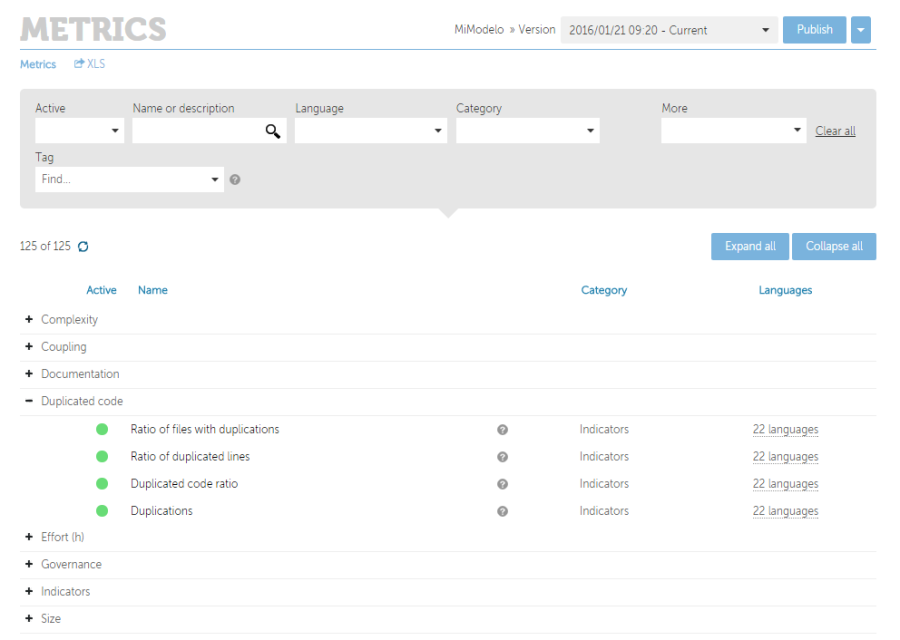 Image Removed
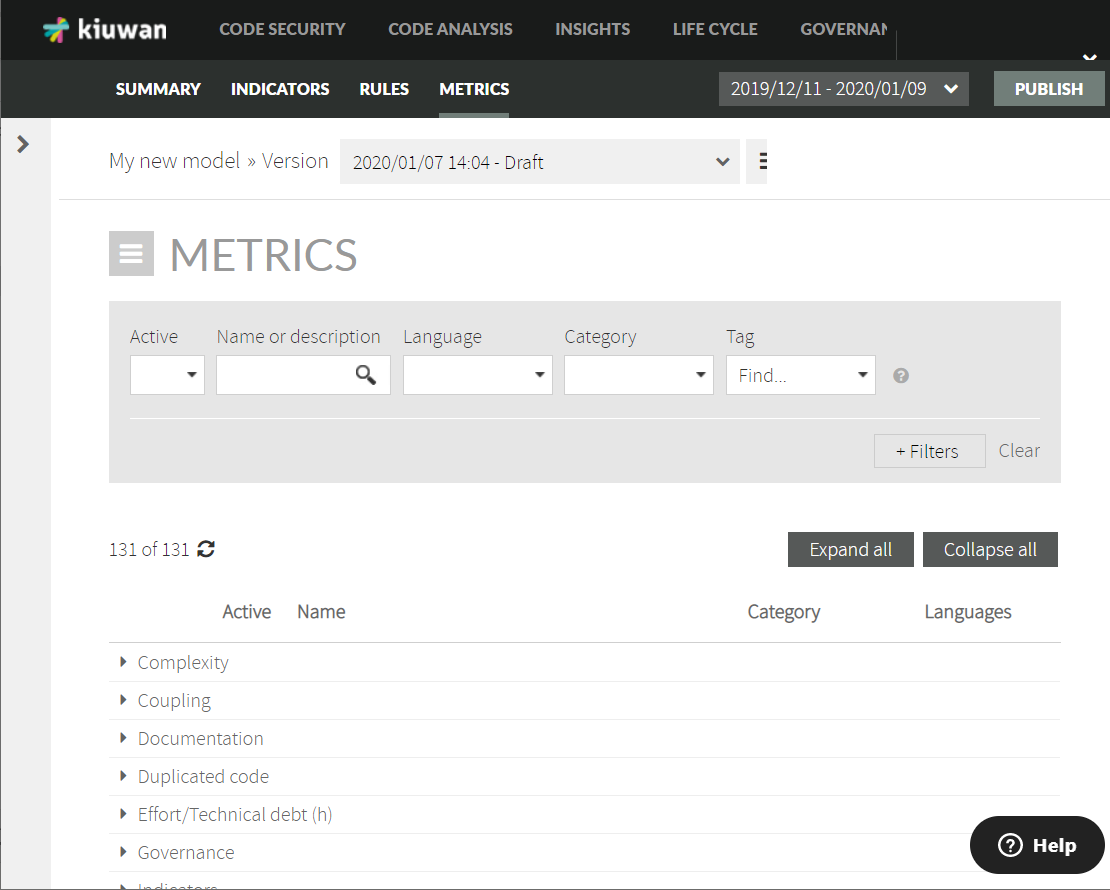 Image Added
Metrics Section
Filters
This is the first part of the metrics section, where you can filter which metrics are shown.
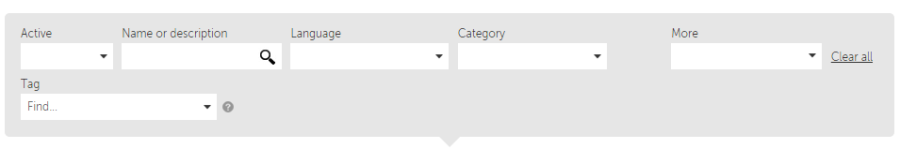 Image Removed
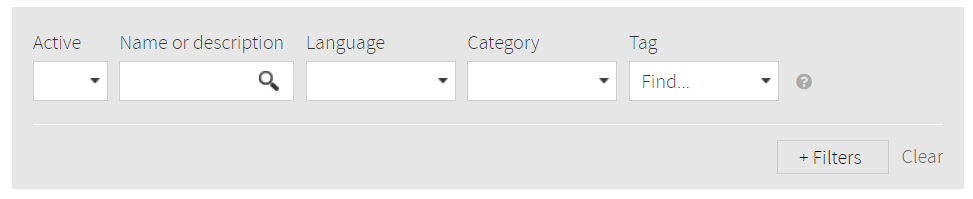 Image Added
The default filters are:
| Name | Description |
|---|
| Active | Shows the active metrics. |
| Name or description | Shows the metrics which match with the pattern written. This pattern is contained in the name or description of the metric and is |
highlighting | highlighted in the metrics tree. |
| Language | Shows the metrics which match the selected language. |
| Category | Shows the metrics which match the selected category. |
| Tag | Shows the metrics that contain one or more tags. |
More | +Filters | Contains more advanced filters:- Metric code filter. Show the metrics whose metric identifier matches the specified pattern.
- Engine version filter. Show the metrics which match with the selected Kiuwan engine version.
- Default configuration filter. Shows the metrics which have the default configuration.
|
These filters can be combined one with each other. When activating more than one filter, only metrics that match both filters will be are shown.
Each time the filter is changed, the metric counter under the filter section will be is updated according to the specified filter.
Metrics tree
The metrics are shown in this next section. 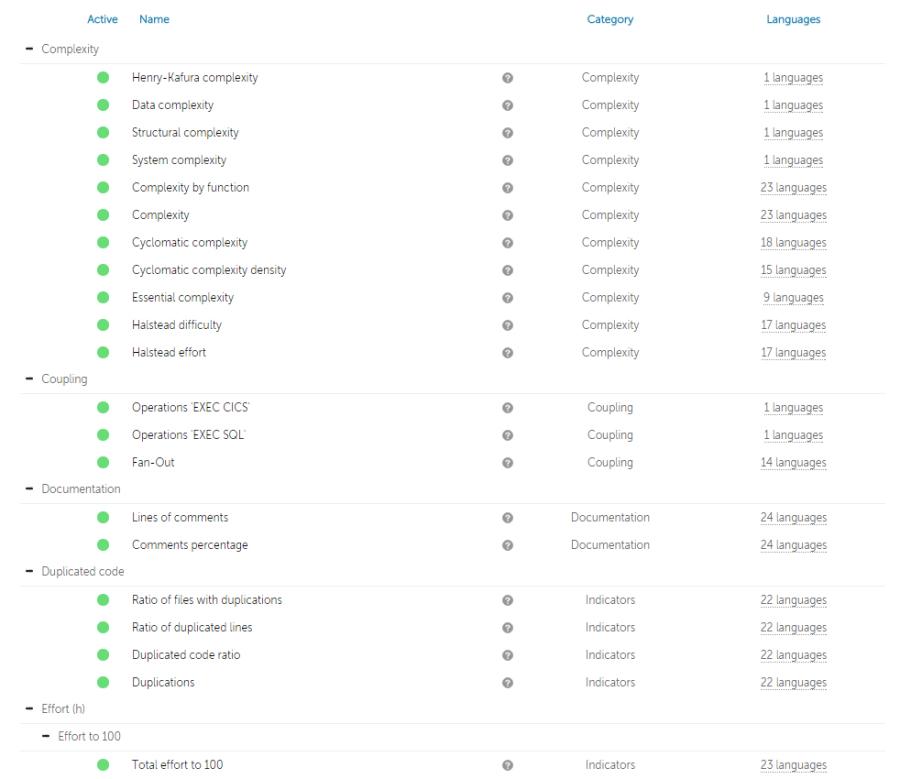 Image Removed
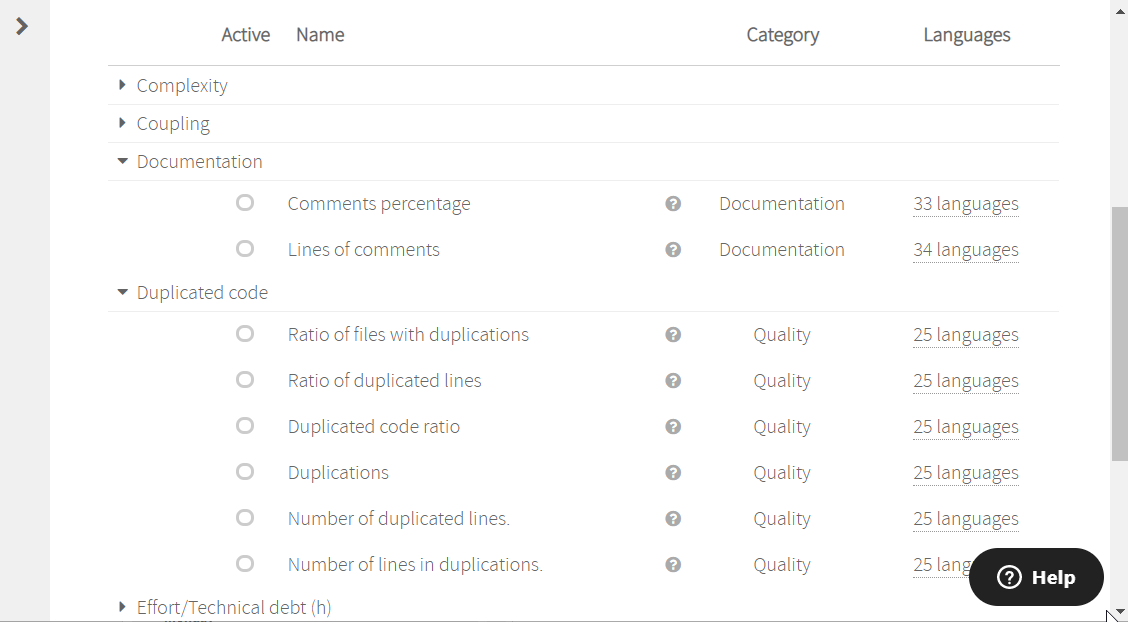 Image Added
The metrics are shown in the form of a tree hierarchy. Nodes can be collapsed and expanded with the Expand all and Collapse all buttons. By default, all metrics are collapsed.
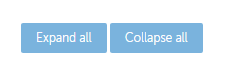 Image Removed
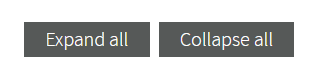 Image Added
Each metric shows its activate status, its name, its category, and the technologies that it implements. Hover Hover the mouse over the concrete language item in a metric to view the languages supported by the metric.
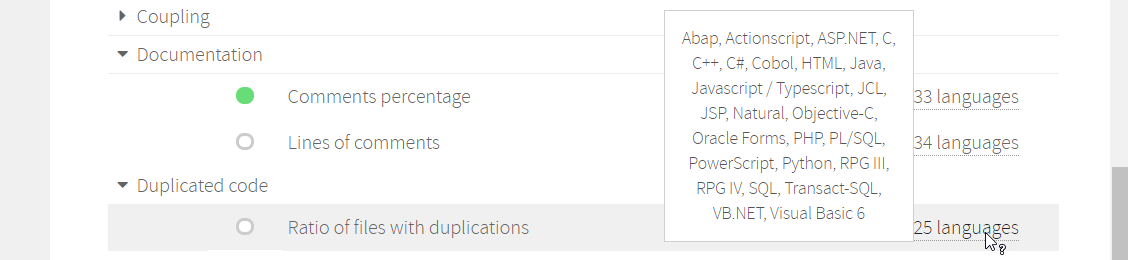 Image Added
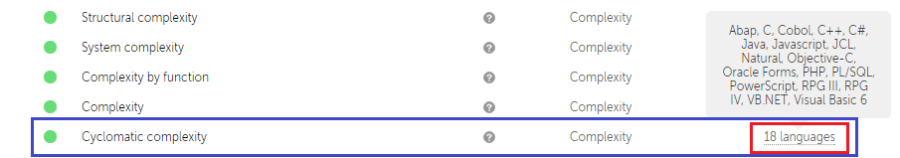 Image Removed
Hover the mouse on over the ? help icon  to view details of some of the properties of each metric.
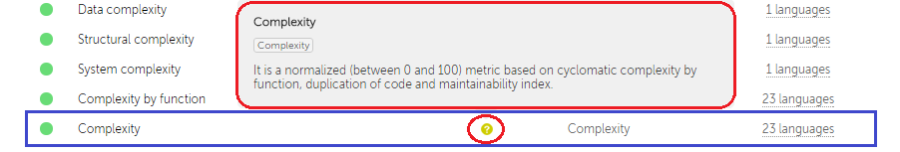 Image Removed
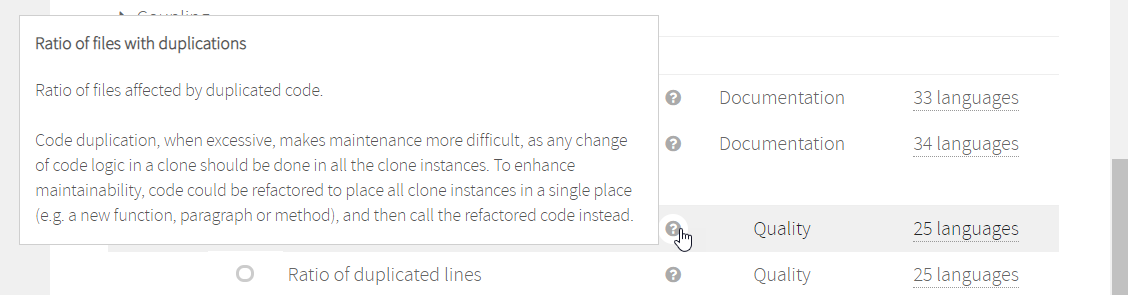 Image Added
Metrics detailsClick the name of a metric to show the metric details window.
This window shows the full information of the selected metric. This information is separated into different sections as described below.
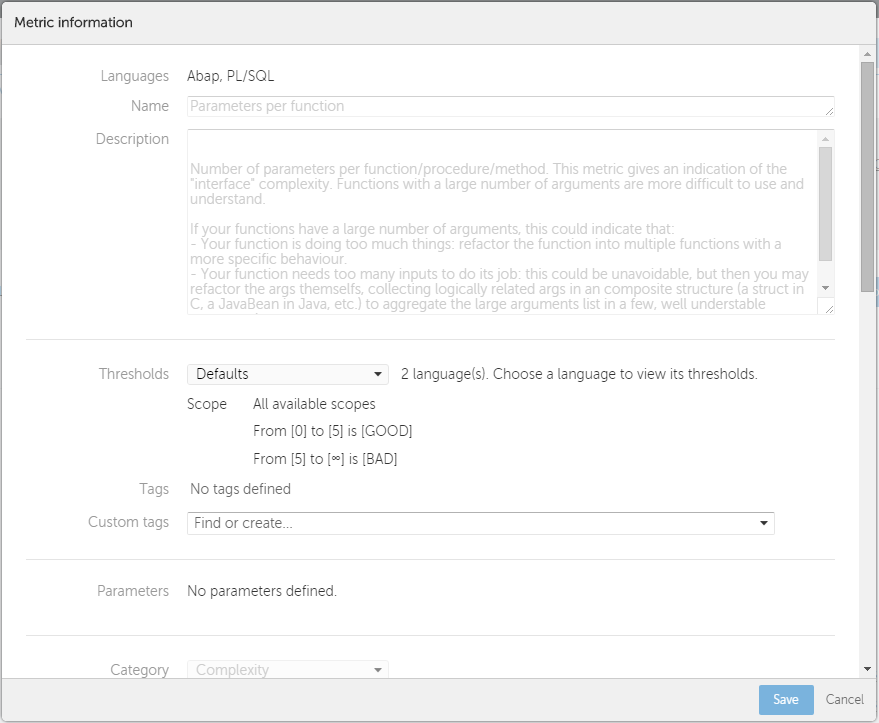 Image Removed
Metric definition
It contains basic information about the metric: 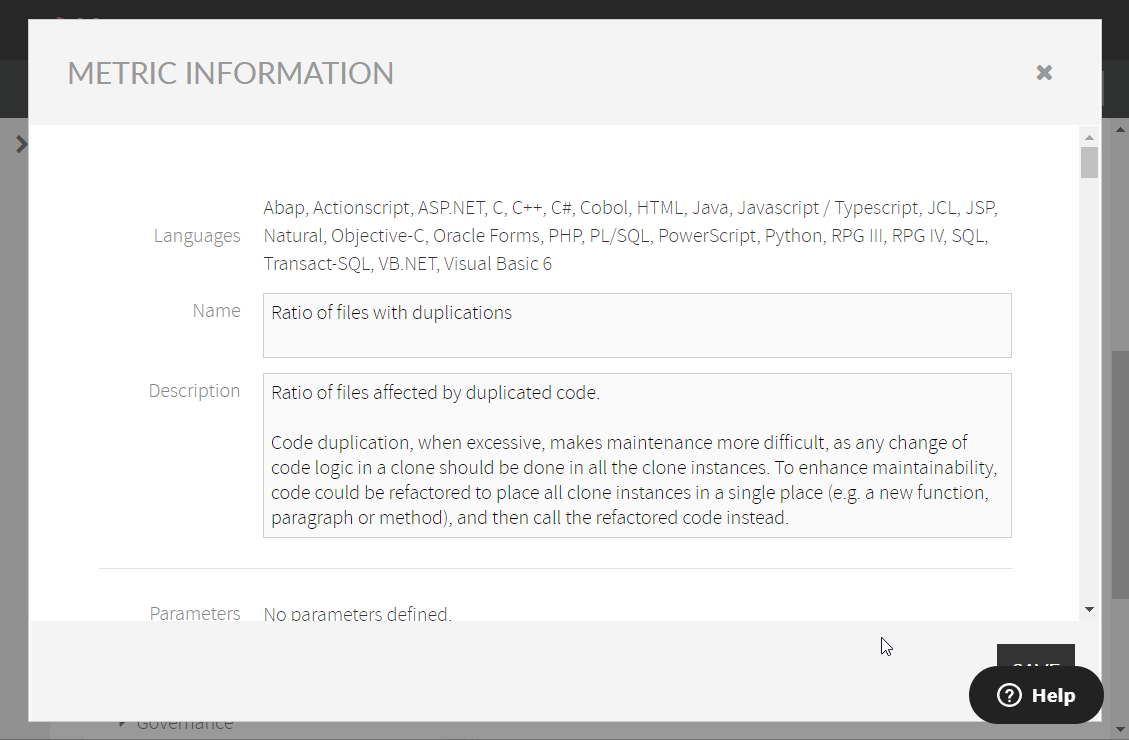 Image Added
| Name | Description |
|---|
| Languages | The languages this metric covers. |
| Name | Name of the metric. |
| Description | A full |
| description of the metric explaining how it operates and the programming languages it applies to. |
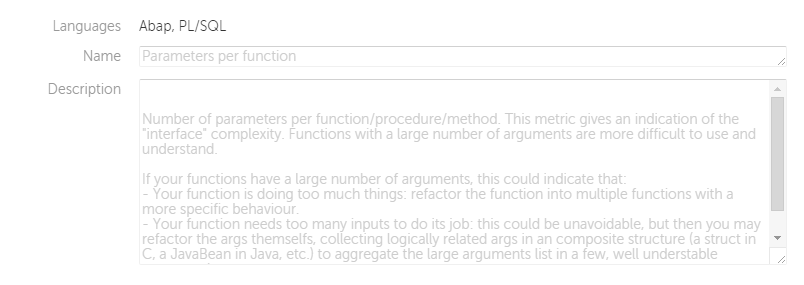 Image Removed
| Parameters | The parameters of the metrics. |
| Thresholds | It contains indicative information about which metric values are considered: Good, Bad, or Regular. Thresholds can be defined by technology. |
 Image Removed
| Tags | Metrics can be tagged. The |
| is editable and you can add your own tags or use Kiuwan's. |
| Name | Description |
|---|
| It shows the category the metric belongs to. This value is not editable. |
| Range |
and Value meaning | It shows the valid values for the metric and how to know when a value is good for your application. These values aren't editable. |
References| Value meaning | It shows the documentation references for the metric. These values aren't editable. |
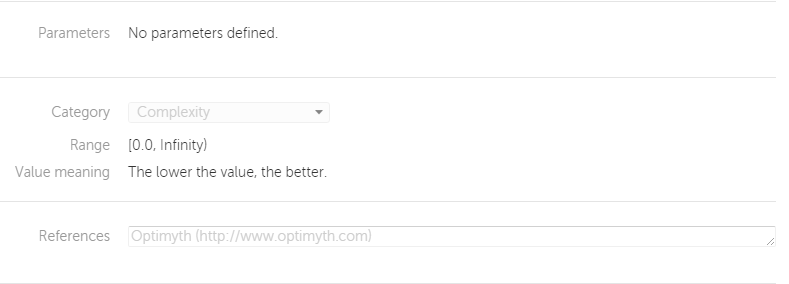 Image Removed
 |
| References | References to the source of the metric. |
| Code |
| Examples | This section shows the value obtained when the metric is applied to the code examples provided. A code example is provided for each supported technology. |
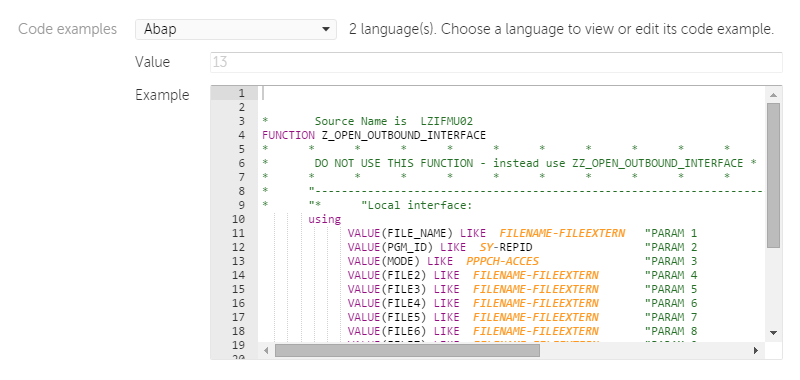 Image Removed of the metricIt shows advanced information fields. Most of them related to the internal implementations of the metric: field field field field field field
- field.
- Last modification date
|
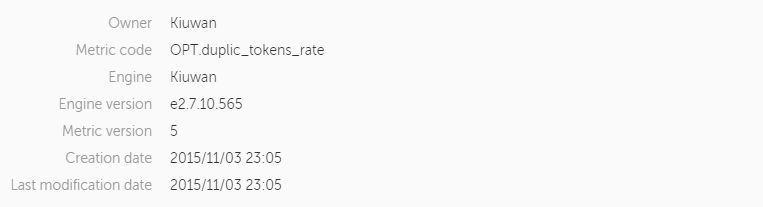 Image Removed
In the Implementations section, you can choose | Implementations | Choose one of the technologies supported by the metric and |
| see its implementation code, Java class, and description. |
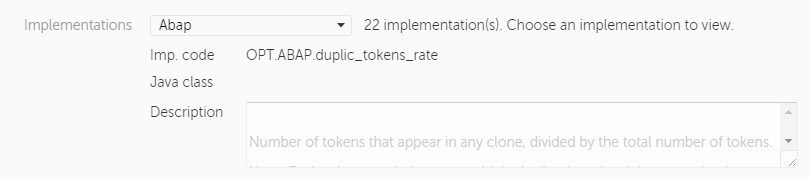 Image RemovedIn the section, the
 | The name-value pairs of the parameters used internally by the metric |
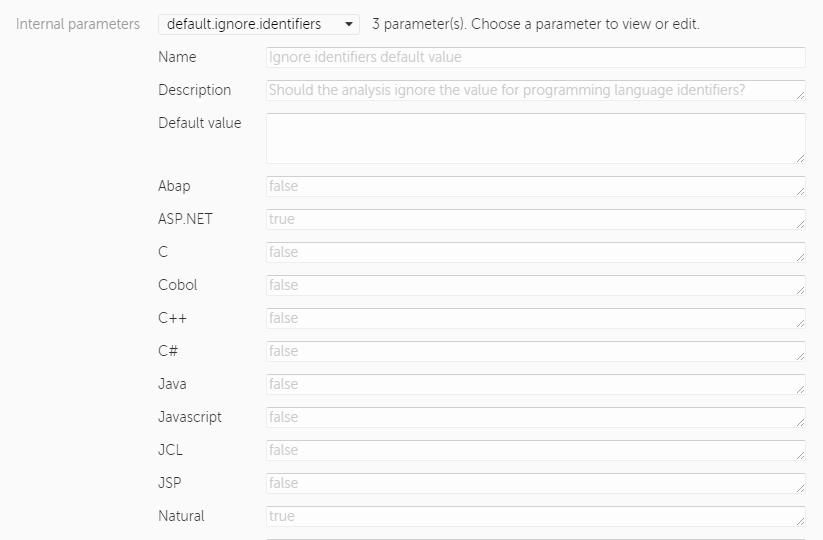 Image Removed
None of these fields are editable