This page will explain explains the Decisions Quadrants section of Kiuwan Governance.
Contents:
| Table of Contents |
|---|
Go to Governance > Decisions Quadrant to access this page.
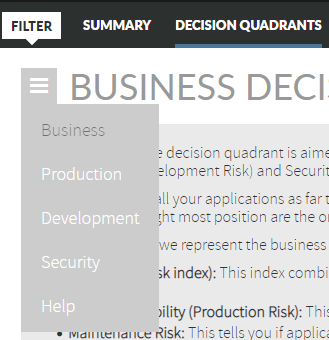
Open the hamburger menu on the left of the page title to access these sections: Business, Production, Development or Security.
Here your applications are Clicking on 'Decision Quadrant', you will land to a page where your applications will be shown in four different graphics, depending on their their business value, failure probability, maintenance risk, and security risk. You will be able to see any of these graphics clicking on the proper button: Business, Production, Development or Security.
Below each of these graphics, there are some metrics with data of your applications: the their number of them, the total lines of code and the results of the main indicators. And then you will be able to see all your applications in a list, sorted by different criteria.
You can group Group the applications shown by portfolios, and so the graphics will vary.
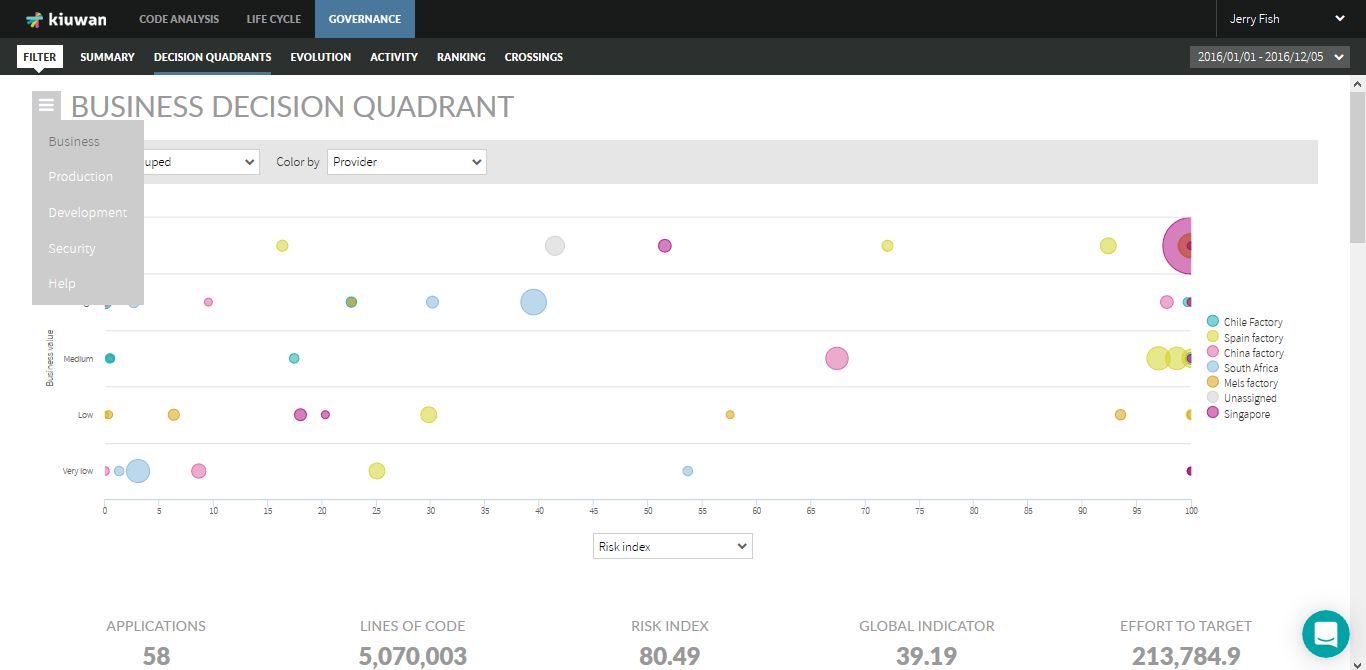
Business
The business value decision quadrant is aimed to identify those applications in your portfolio that require immediate action based on their criticality for the business and their exposure to any of risks you are facing: Global Risk (Risk index), Failure Probability (Production Risk), Maintenance (Development Risk) and Security Risk.
You want to have all your applications as far to the left of the graph possible, regardless of the risk you are displaying. The higher the applications in the graph the more you want these applications closer to the left axis since these are your most critical applications. The applications with the higher and rightmost positions are the ones needing immediate action (higher risk).
In the vertical axis, we represent the business value (criticality) you have decided your applications have. It can have 5 different values, from critical to very low. The metric in the horizontal axis can be chosen from the 4 types of risk we calculate for your applications:
- Global Risk (risk index): This index combines the application quality (taking into account all software characteristics), the effort to repair based on the target for each application and the application size. If the risk index is high you should invest in quality (redesign) . This means redesigning the application.
- Failure Probability (Production Risk): This indicates if applications are likely to provoke frequent errors in production. Applications with high Failure Probability could be a problem in the short term.
- Maintenance Risk: This tells you shows if the applications’ maintenance costs are going to be higher than expected, or if it is going to be complex and costly to add new functionality to them. If the Maintenance Risk is high it could be a problem in the midterm.
- Security Risk: This indicated indicates how vulnerable an application is to internal or external attacks based on the number of vulnerabilities found in the application’s code as listed by CWE and OWASP. A high-Security Risk indicates that applications have more exploitable vulnerabilities that can yield to security breaches of all kinds.
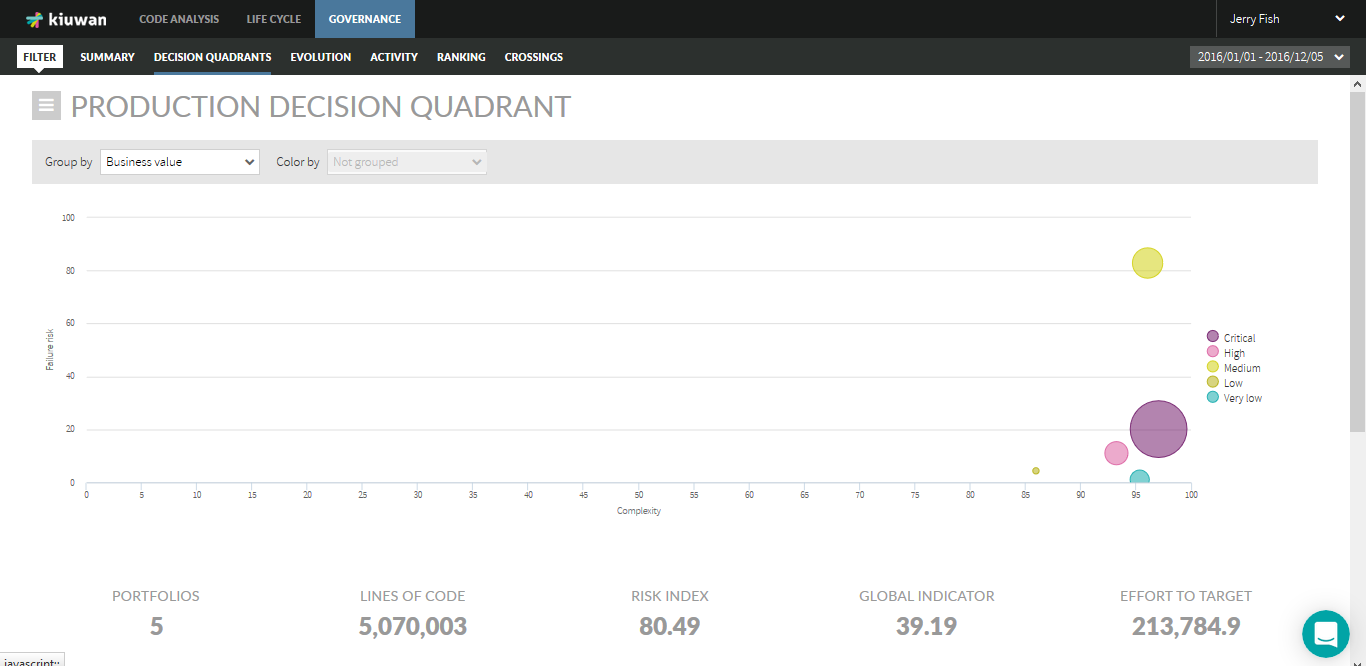
Production
The Production quadrant is aimed to identify identifying those applications in your portfolio that could cause problems in production, and if they will be able to recover from these errors easily. The applications with higher exposure to this kind of risk will be those in the upper-right area of the quadrant.
In the The vertical axis , we represent represents Failure Probability. This indicates if applications are likely to provoke frequent errors in production. Applications with high Failure Probability could be a problem in the short term.
In the The horizontal axis , we represent represents application Complexity, a normalized (between 0 and 100) metric based on the applications’ cyclomatic complexity by function, duplication of code and maintainability index.
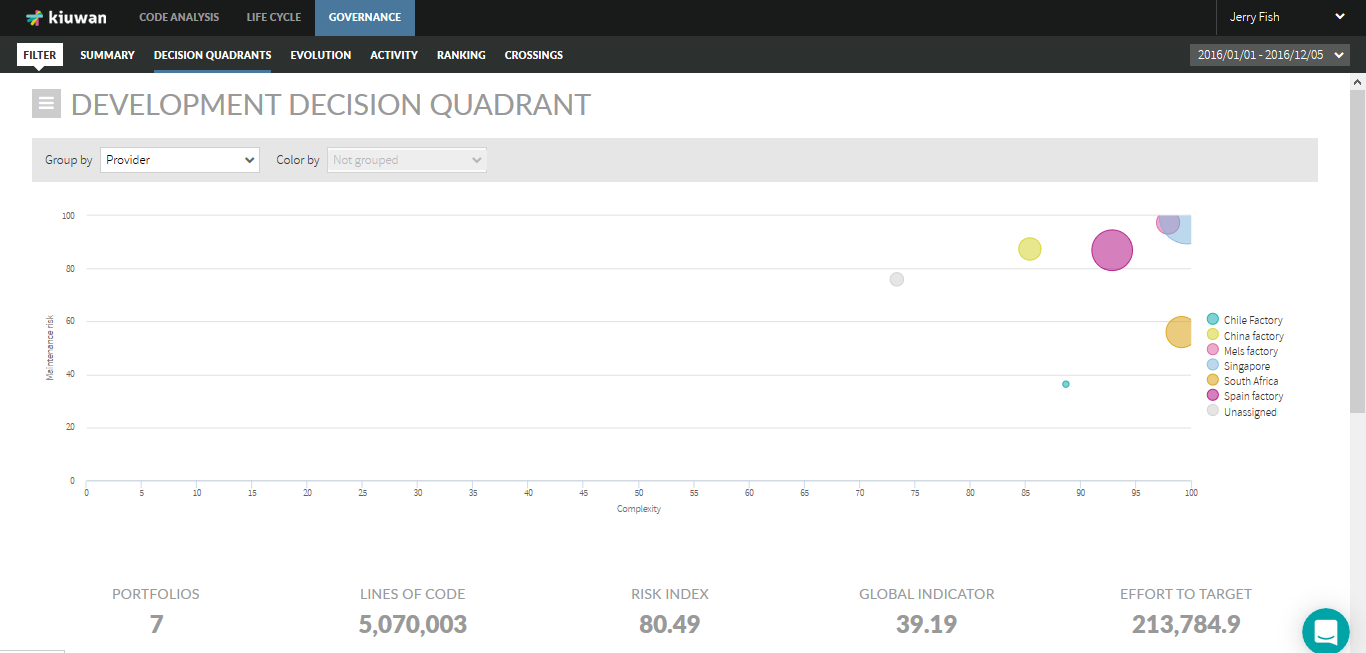
Development
The Development quadrant is aimed to identify identifying those applications in your portfolio exposed in the midterm given the difficulty and associated cost to maintain them. The applications with higher exposure to this kind of risk will be those in the upper-right area of the quadrant.
In the The vertical axis , we represent the represents Maintenance Risk: this indicates if the applications’ maintenance costs are going to be higher than expected, or if it is going to be complex and costly to add new functionality to them. It is based on the evidence gathered from the code for the maintainability index.
In the The horizontal axis , we represent represents application Complexity, a normalized (between 0 and 100) metric based on applications’ cyclomatic complexity by function, duplication of code and maintainability index.
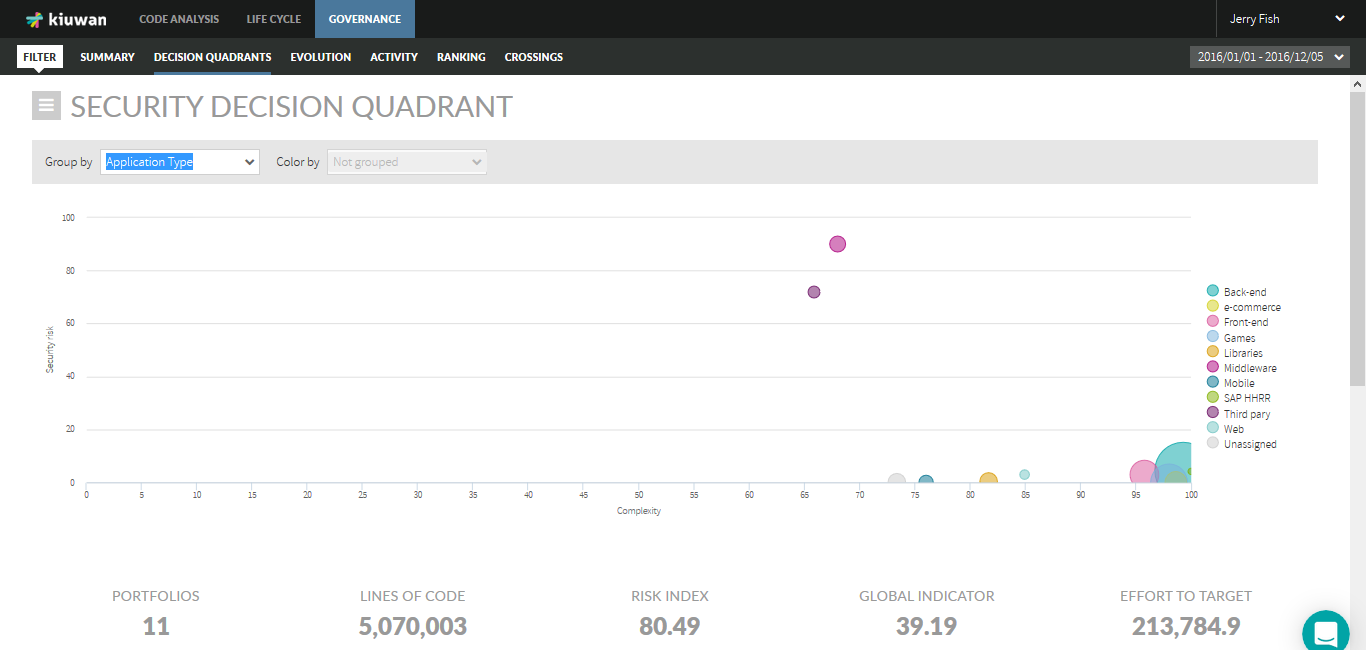
Security
The Security quadrant is aimed to identify identifying those applications in your portfolio that are exposed to potential internal or external attacks, that can compromise the integrity of your organization, and if these potential vulnerabilities can be easily corrected. The applications with higher exposure to this kind of risk will be those in the upper-right area of the quadrant.
In the The vertical axis , we represent represents the Security risk: This indicated indicates how vulnerable an application is to internal or external attacks based on the number of vulnerabilities found in the application’s code as listed by CWE and OWASP.
In the The horizontal axis , we represent represents application Complexity, a normalized (between 0 and 100) metric based on applications’ cyclomatic complexity by function, duplication of code and maintainability index.