...
Available widgets:
- Ranking DataTable
For a fully understanding on Governance - Rankin, please visit https://www.kiuwan.com/docs/display/K5/Ranking.
...
- Business Value
- Lines of Code (LOCs)
- Risk Index
- Global Indicator
- Effort to Target
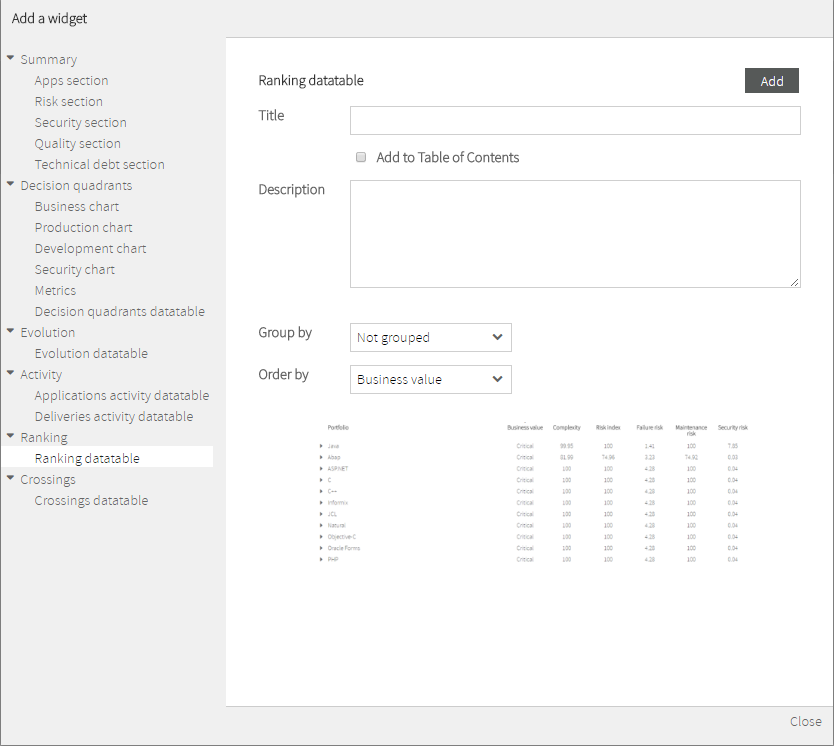
Every record can be customized to represent:
...
Additionally, the data table records can be ordered by any of the above columns by using the Order by selector.
<< R_W_08.png>>
Crossings
Crossings widgets are those that allow to display a table where you can pick the metric whose values you want to see, crossing the data of two different portfolios you want to compare.
Available widgets:
- Crossings DataTable
...
For a fully understanding on Governance - Rankin, please visit https://www.kiuwan.com/docs/display/K5/Crossings.
...
As a result, you will get a table where column/rows labels represent the different values of the selected portfolios and the inner cells will represent the aggregated data (added or averaged) of the selected metric for all the applications that belongs to both portfolio values.
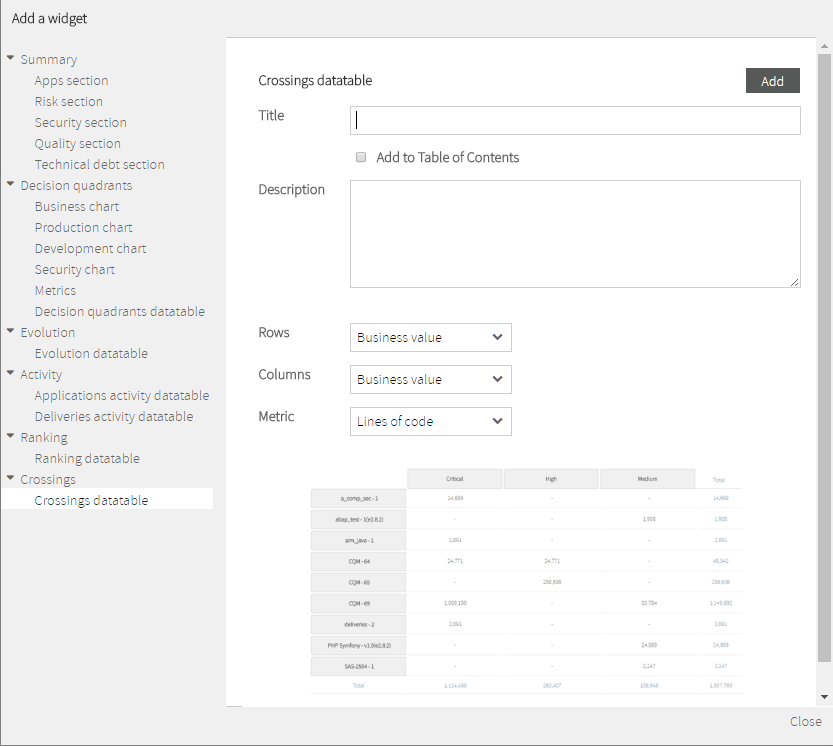
<< R_W_09.png>>