...
When selecting the widgets, every widget has configuration options that you will set to adapt the widget to your desired functionality. Please see next section sections on available widgets.
The selection and configuration of the widgets will let you to define the content of your report. What information will be included and how will be displayed in the generated report.
Once the report is created, you will publish to make it generally available to the rest of the users. At any time, you will be able to modify any published report.
Reports Structure
...
A Kiuwan Report follows next structure
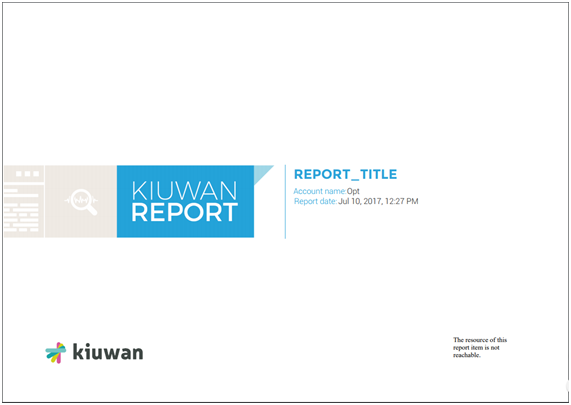
1.- Report First-Page
This 1st page contains basically the Title of the report, the Account Name (i.e. the descriptive name of the Kiuwan account, usually it’s the Company name) and the date generation report.
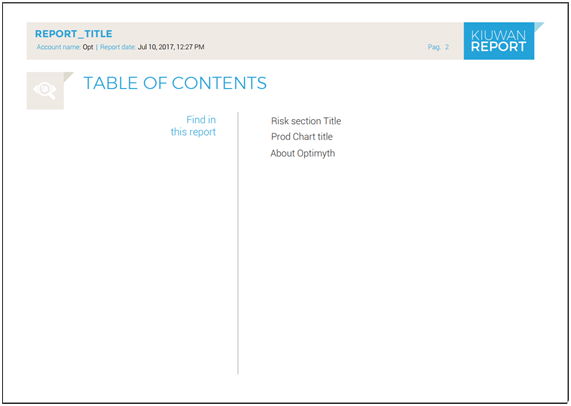
2.- Table of Contents
A Table of Contents (TOC) that shows the different sections of the Report. As you will see later, you decides whether a section appears or not in the TOC.
3.- Pages with designed Widgets
Every selected widget will be presented as a page of the report. At the time of report creation, you decide exactly what information will be included in the widget.
...
To save your work in the report, you can click on Save button. This will save it and will ask you for report name and title.
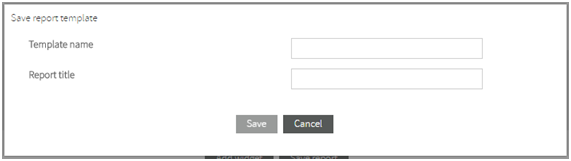
- “Report Name”“Report Name”: an internal name that fully identifies the report to Kiuwan users
- “Report Title”“Report Title”: the title of the report, i.e. the title that will appear at the first page of the generated report as well as a heading for all the report pages.
...
And next image shows an example of a page heading.

Reports Generation
...
Every created report will be available to Kiuwan users.
| Info |
|---|
Any user will be able |
...
to generate the report selecting the report and clicking on Generate option. |
When . When the user selects to generate a report, next dialog is presented.
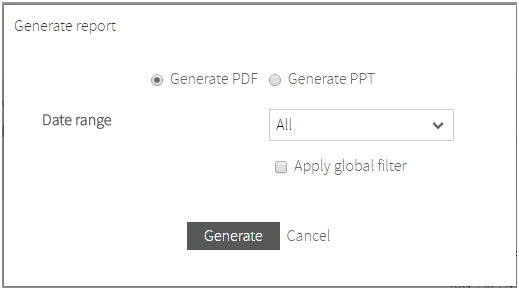
Report Format:
You can select between PDF or PowerPoint. The latter option lets you further edit your reports.
Data Range:
The report will be built based on available data during the selected time period. To define the data range, there are two options:
- To select one among any of the pre-defined data ranges that Kiuwan provides (All, Today, This month, Last 30 days, etc)
- To use the active global filter (i.e. that one currently active in the Calendar)
Report Widgets
...
| Info |
|---|
Kiuwan provides a complete library of widgets that you can use to build your custom report. |
When you are creating the report, the widgets are available from a tree-like palette.
You select any of them, configure its specifics properties and add it to the report.
...
Almost every widget shares some common characteristics:
Title / Add to TOC
Every widget will be presented as a page of the report.
Title lets you provide a string (a title) that will identify the report page.
You will then decide either this title appears or not in the Table of Contents of the report.
Description
A text you provide to explain the data displayed by the widget.
Specific properties
Depending on the widget, you can select additional properties to decide the degree of detailed information that will be printed.
These properties will be included in final reports as the next image shows.
Summary
| Info |
|---|
Summary widgets |
...
allow to represent global (aggregated) information about application metrics. |
Available widgets:
- Apps Section
- Risk Section
...
For a fully understanding on Kiuwan Indicators, please visit https://www.kiuwan.com/blog/kiuwan-indicators/ .
Apps Section
Apps Section Widget widget allows to include summary data about number and distribution of applications by several criteria:
...
<< R_W_01.png>>
Risk Section
Risk Section Widget widget allows to include summary data about number and distribution of applications based on Risk Index metric:
- Average of Risk Index
- Frequency of Apps, by Risk ranges
- Average Risk, by selected portfolio (Business Value, by default)
<< R_W_02.png>>Please, visit https://www.kiuwan.com/blog/kiuwan-indicators/ for further information on Kiuwan Indicators.
Security Section
Security Section Widget widget allows to include summary data about number and distribution of applications based on Security Rating metric:
...
Please, visit https://www.kiuwan.com/docs/display/K5/Kiuwan+Code+Security for further information on Code Security.
Please, visit https://www.kiuwan.com/blog/kiuwan-indicators/ for further information on Kiuwan Indicators.
Quality Section
Quality Section Widget widget allows to include summary data about number and distribution of applications based on Global Indicator metric:
- Average of Global Indicator
- Frequency of Apps, by Global Indicator ranges
- Average Global Indicator, by selected portfolio (Business Value, by default)
...
- selected portfolio (Business Value, by default)
Technical Debt Section (XXXX)
...
- Average of Global Indicator
- Frequency of Apps, by Global Indicator ranges
- Average Global Indicator, by selected portfolio (Business Value, by default)
...
Decision quadrants
Decision Quadrant widgets allow to represent XXXXX.
...
For a fully understanding on Decision Quadrants, please visit https://www.kiuwan.com/docs/display/K5/Decision+quadrants.
Business
...
Chart
Business chart Widget Chart widget allows to include a Business Value Decision Quadrant in your report.
...
- Diameter (proportional to size in Locs)
- Color (the portfolio value the app belongs to, this option is only available when Color by selector has been set to any to the available portfolios)
<< R_W_03.png>>
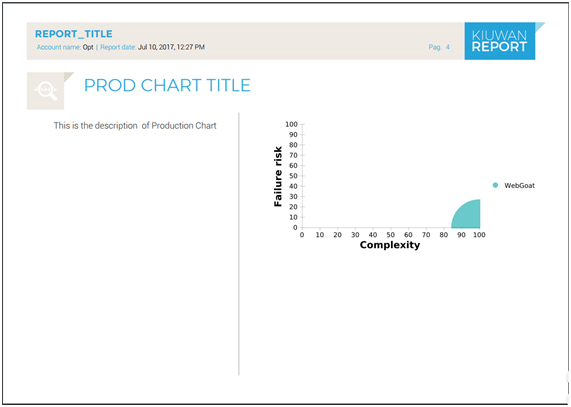
Production
...
Chart
Production chart Widget Chart widget allows to include a Production Decision Quadrant in your report.
...
- Diameter (proportional to size in Locs)
- Color (the portfolio value the app belongs to, this option is only available when Color by selector has been set to any to the available portfolios)
<< R_W_04.png>>
Development
...
Chart
Development chart Widget Chart widget allows to include a Development Decision Quadrant in your report.
...
- Diameter (proportional to size in Locs)
- Color (the portfolio value the app belongs to, this option is only available when Color by selector has been set to any to the available portfolios)
<< R_W_05.png>>
Security
...
Chart
Security chart Widget Chart widget allows to include a Security Decision Quadrant in your report.
...
- Diameter (proportional to size in Locs)
- Color (the portfolio value the app belongs to, this option is only available when Color by selector has been set to any to the available portfolios)
<< R_W_06.png>>
Metrics
Metrics Widget widget allows to XXXXXX
Decision Quadrants DataTable (XXXXXX)
Decision Quadrants DataTable Widget widget allows to include a data table of records (one application or group of applications per row) with the following summarized information:
...
<< R_W_07.png>>
Evolution
Evolution widgets widget display timely evolution of an application or a portfolio on a selected metric or indicator.
...
For a fully understanding on Governance - Evolution, please visit https://www.kiuwan.com/docs/display/K5/Evolution.
Evolution DataTable
Evolution DataTable Widget widget allows to include timely evolution data of an application or a portfolio on a selected metric or indicator.
...
Additionally, the data table records can be ordered by any of the above columns by using the Order by selector.
<< R_W_07.png>>
Ranking
Ranking widgets are those that allow to display rankings of applications (or applications grouped by portfolios) on a selected metric or indicator.
...
For a fully understanding on Governance - Rankin, please visit https://www.kiuwan.com/docs/display/K5/Ranking.
Ranking DataTable
Ranking DataTable Widget widget allows to include a ranking of applications (or applications grouped by portfolios) on a selected metric or indicator.
...
Additionally, the data table records can be ordered by any of the above columns by using the Order by selector.
<< R_W_08.png>>
Crossings
Crossings widgets are those that allow to display a table where you can pick the metric whose values you want to see, crossing the data of two different portfolios you want to compare.
...
For a fully understanding on Governance - Rankin, please visit https://www.kiuwan.com/docs/display/K5/Crossings.
Crossings DataTable
Crossings DataTable Widget widget allows to define table where you can pick the metric whose values you want to see, crossing the data of two different portfolios you want to compare.
...