New Analysis
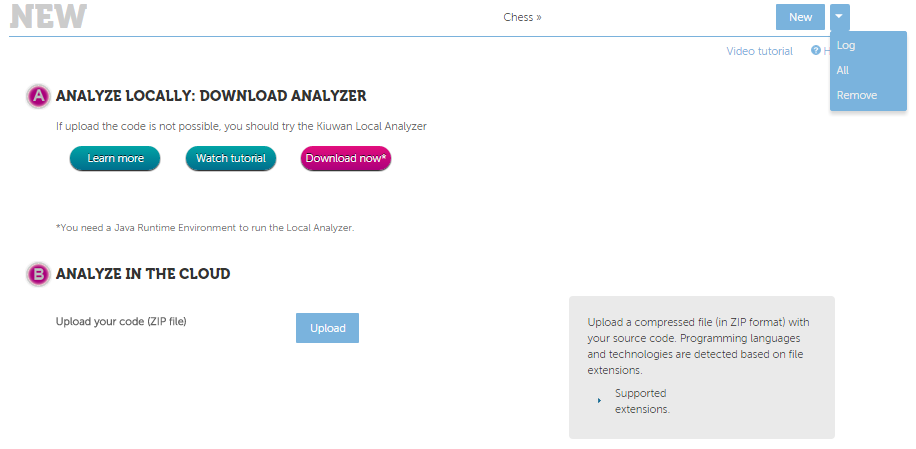
There are two possibilities to analyze the application code: uploading the source code to Kiuwan server or analyzing it on a local machine, if we have previously downloaded and installed the downloadable agent.
A reasonable use of the service does not need to analyze an application more than once a day. While Kiuwan not aim limits, in order to avoid abuses that may harm other users, you will not be able to analyze the same application more than three times a day.
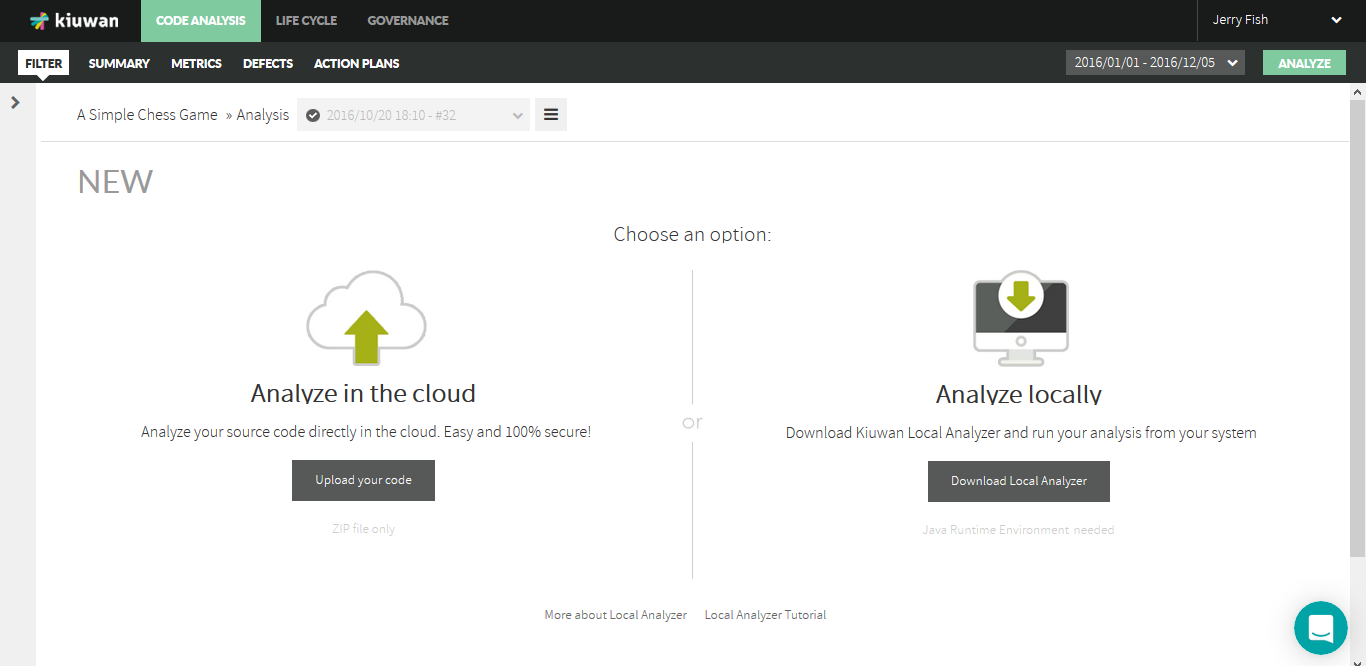
You will be asked about the way you will perform the analysis:
...
The data needed to launch a new analysis are provided in a single screen:
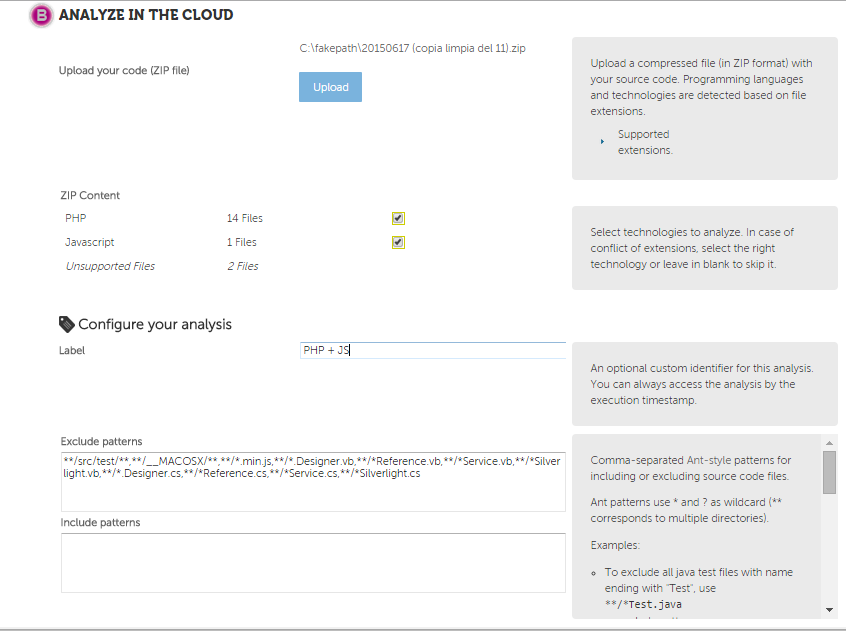
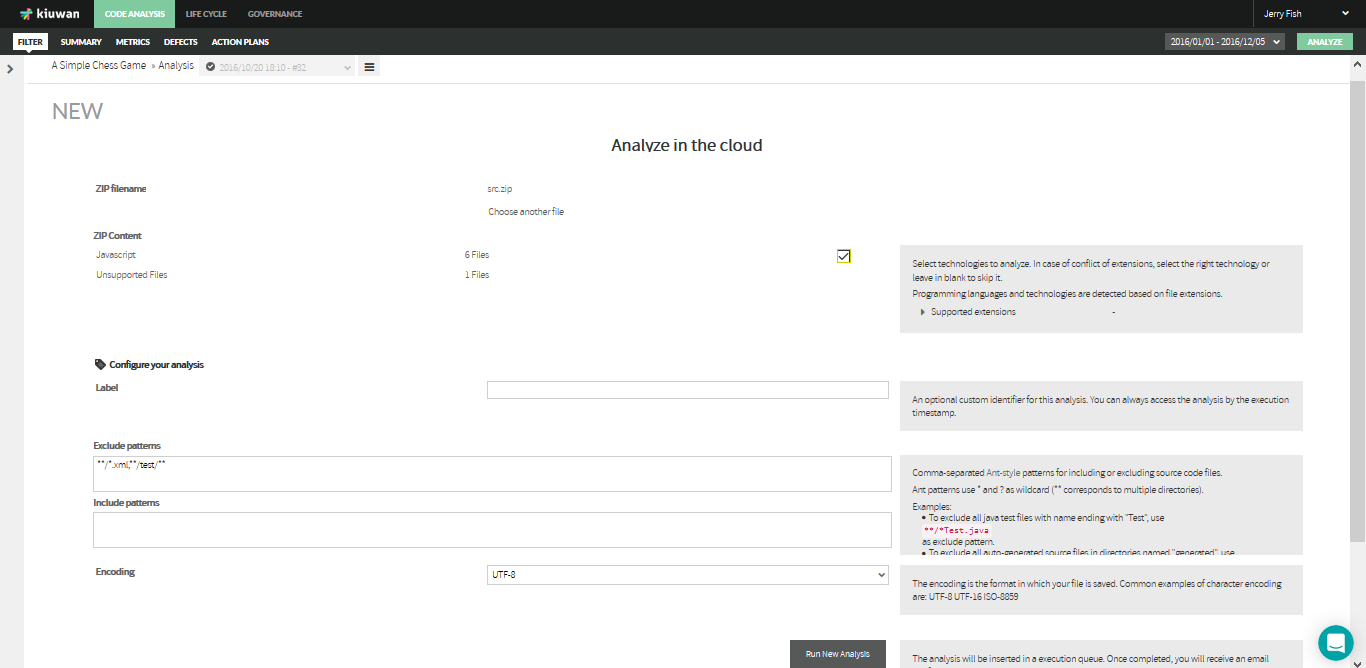
What you need, in order to analyze the application code, is:
...
Once you press the button "Run New Analysis", you will be directed to the Log screen, where you can continue the execution, until its completion, when Kiuwan takes you back to the analyzed application Dashboard.
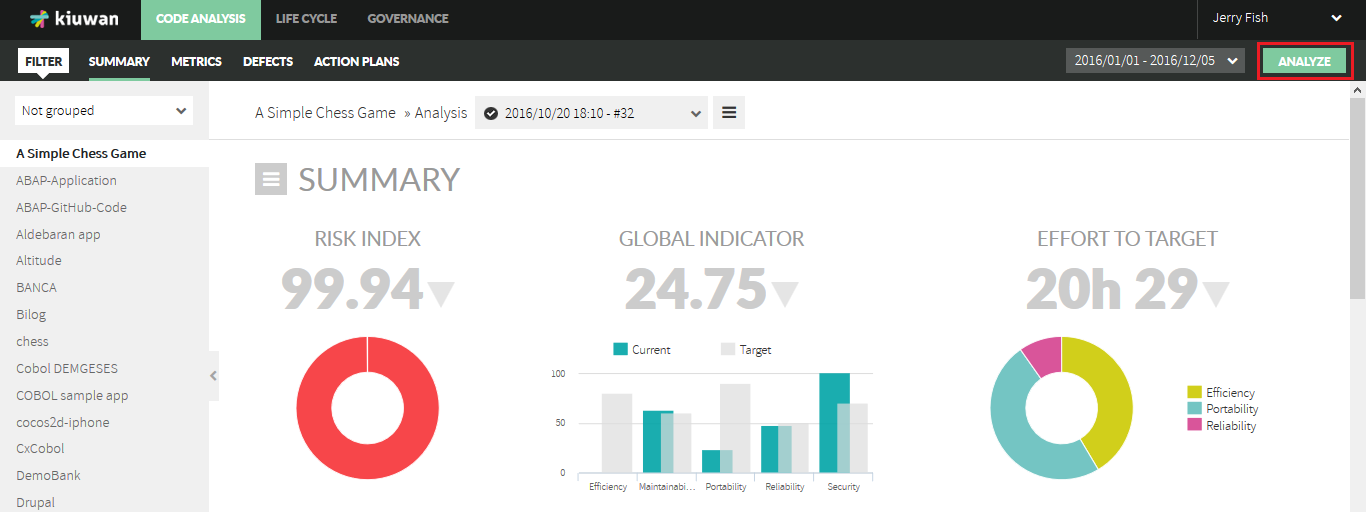
Looking at the Analysis Log
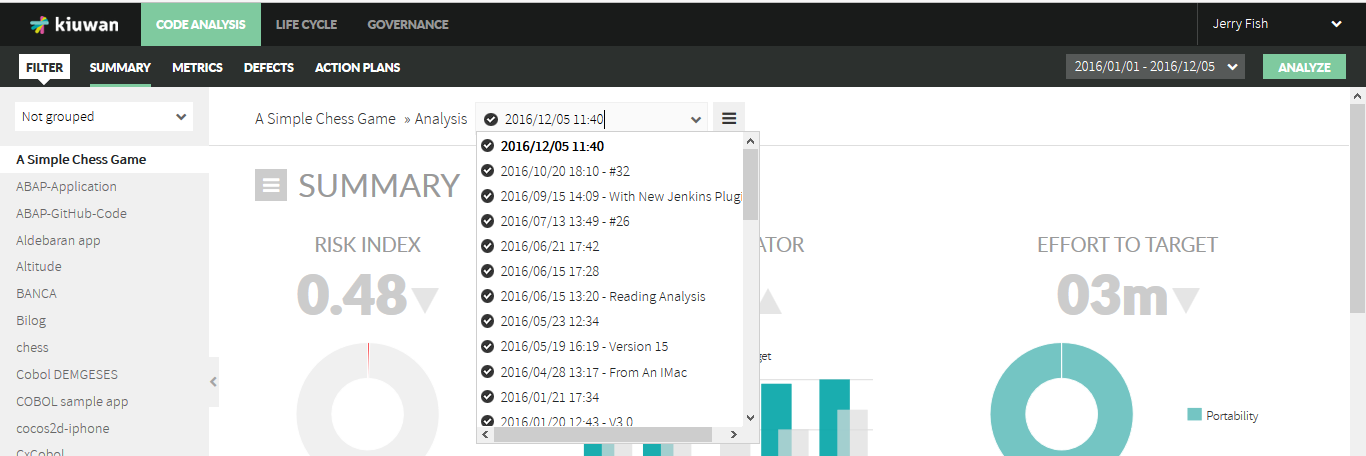
Using the combo in the menu bar, you can pick the analysis of the selected application, for which you want to view its results:
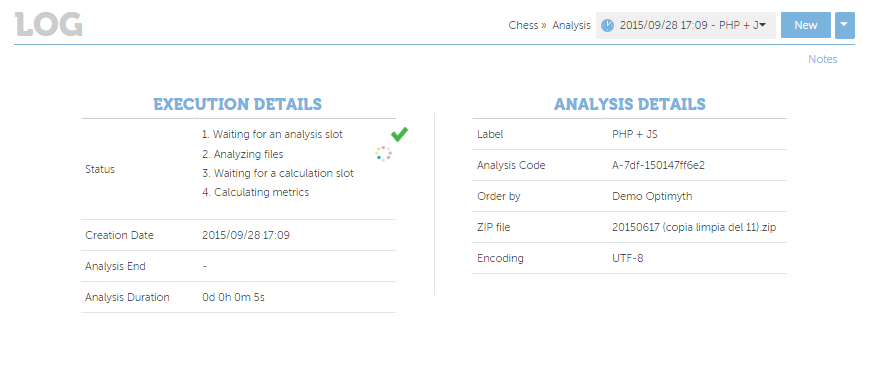
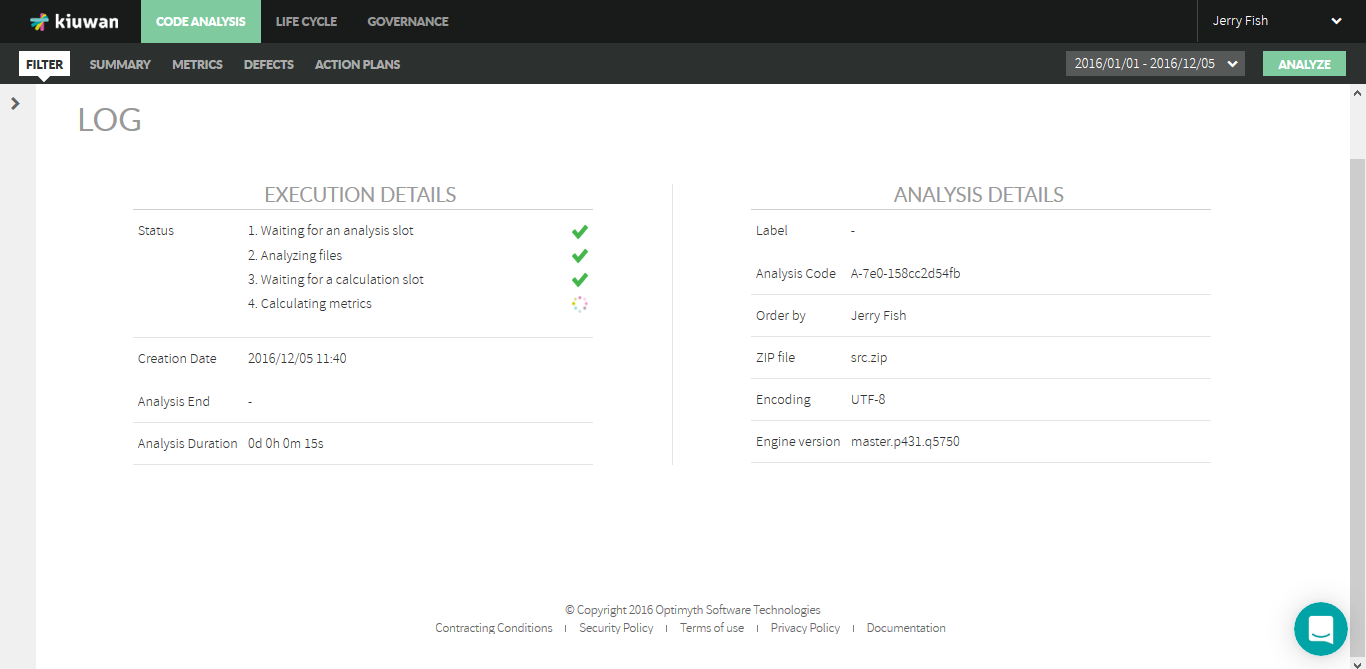
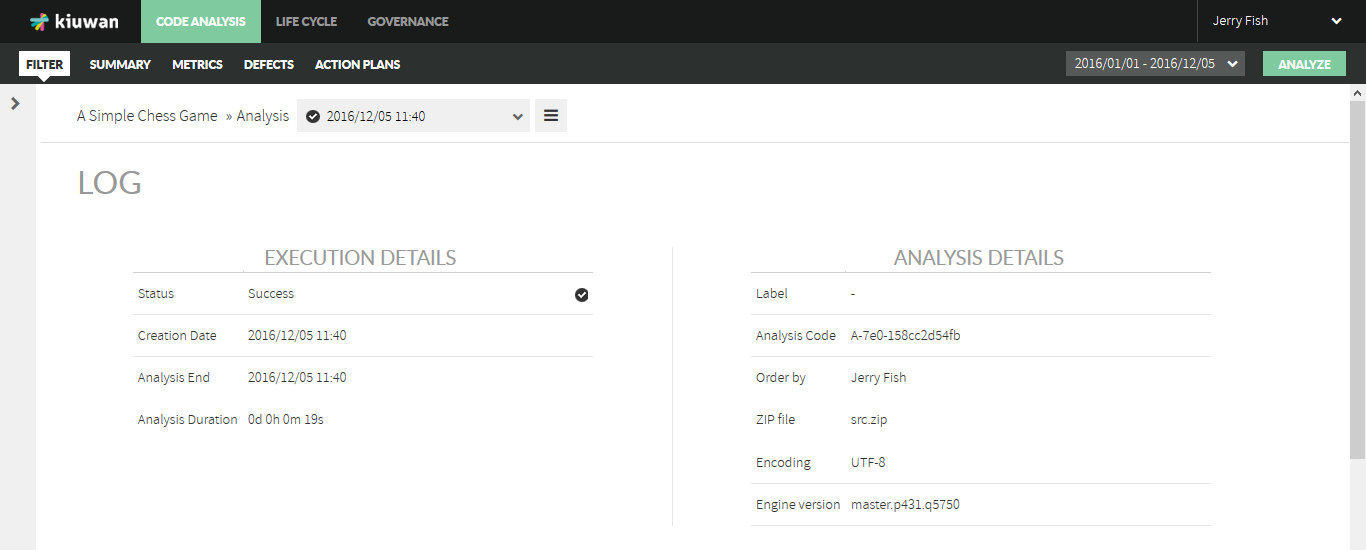
Clicking on the Log icon in the vertical menu, you can get the details of this analysis, as shown in the following screen: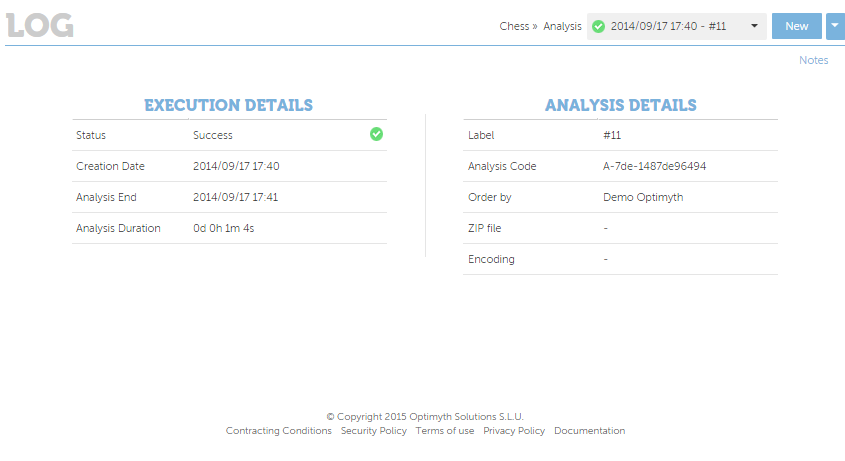
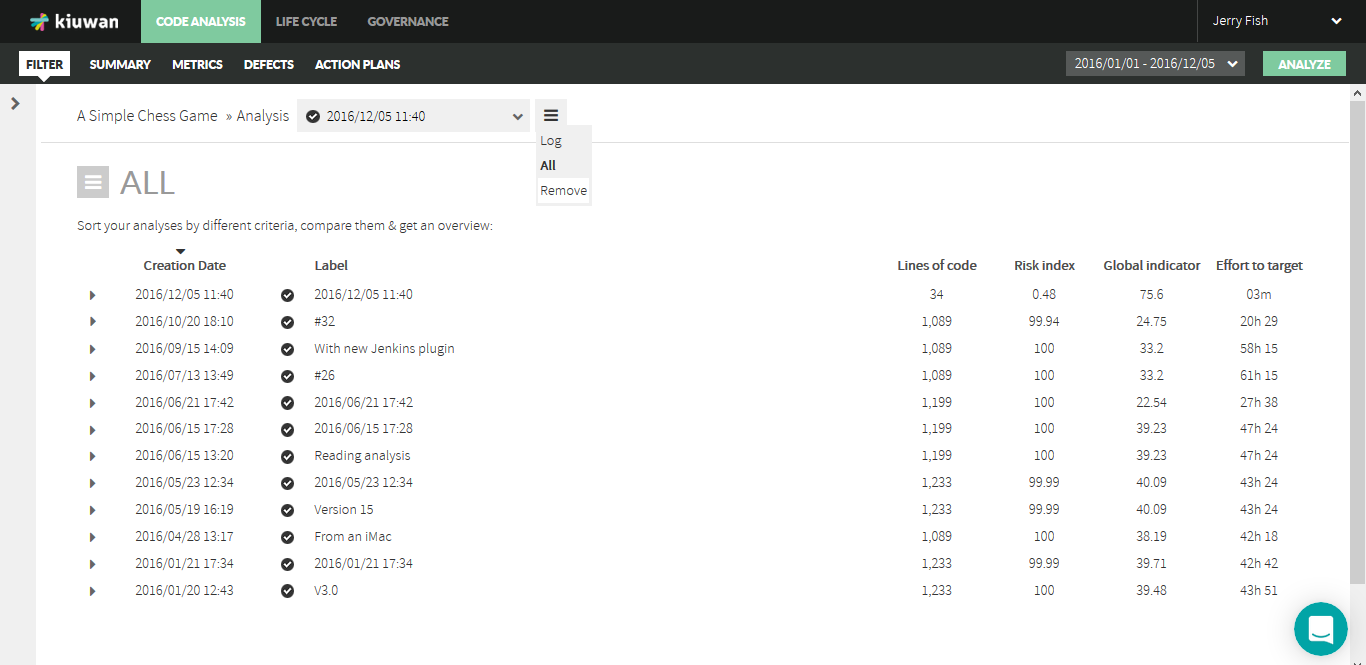
"All" view
...
Clicking "All" button in the vertical menu near to the top right corner of the page, we will see the complete list of all the analyses we have run on the selected application. If we want to change the selected application, we will have to deploy de left menu by clicking on the purple arrow on the top left side and, then, choose the application whose complete list of analyses we want to see.
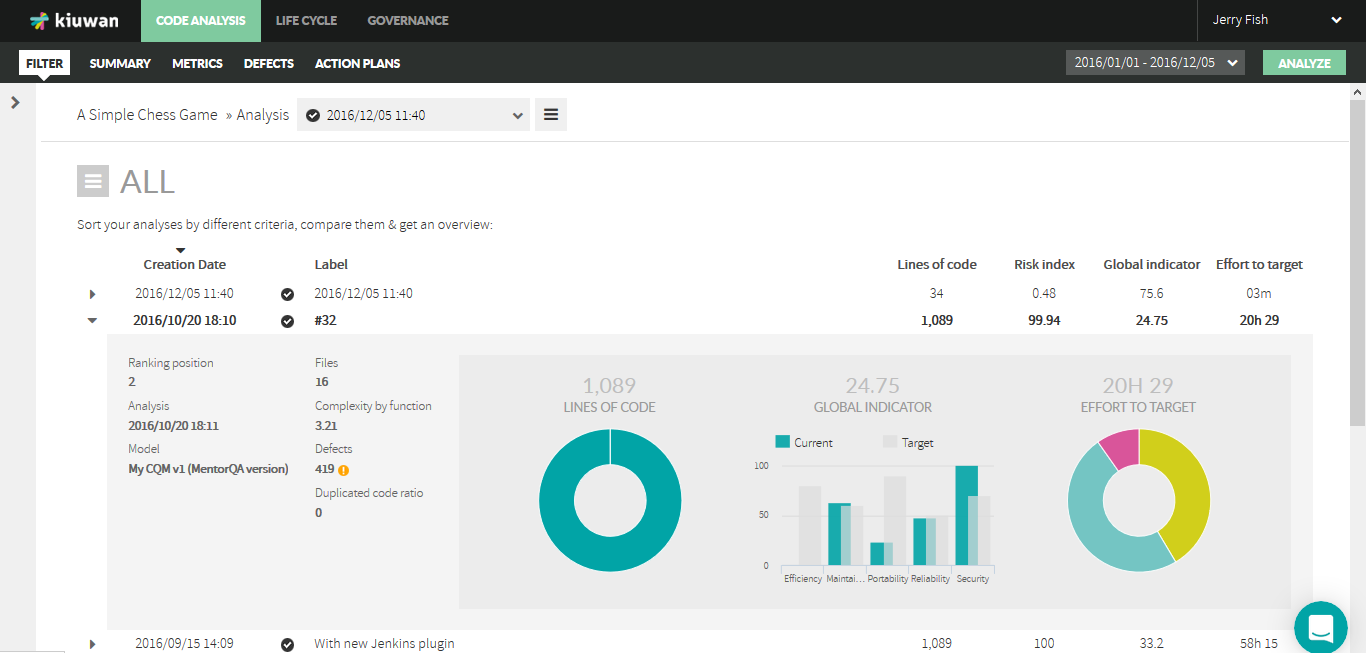
By default, the list is sorted by date, but we can change this sorting criterion by clicking on the column header we want: label, lines of code, risk index, quality indicator or effort to target.
...
The graphing of the distribution in languages of the lines of code.
Removing an Analysis
...
If we want to remove an analysis data, it can be done by selecting Remove option from the Menu Bar, which will ask for confirmation before proceeding. Thereafter, this analysis does not appear in the application metrics timeline diagrams.